by ARA | Nov 19, 2024 | Uncategorized
Novorossiysk PSC Scorecard L36M (Oct. 21 – Sep. 2024) This RISK4SEA Report about Novorossiysk PSC Scorecard L36M (Oct. 21 – Sep. 2024) includes Key PSC Figures in Novorossiysk , analysing the Novorossiysk detention rate vs the Black Sea MoU detention rate, per...
by ARA | Oct 21, 2024 | Uncategorized
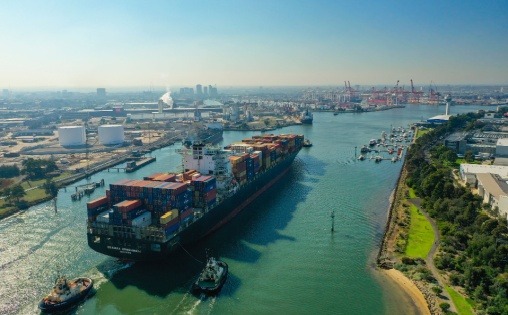
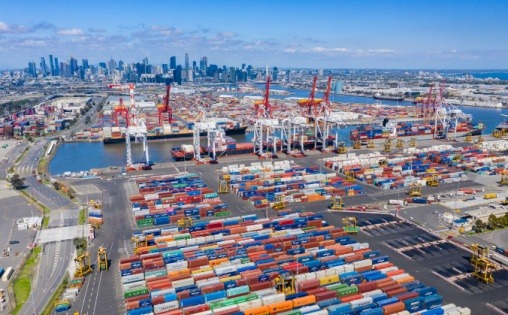
Australia PSC Scorecard L36M (Sep. 2021 – Aug. 2024) This RISK4SEA Report about Australia PSC Scorecard L36M (Sep. 2021 – Aug. 2024) includes Key PSC Figures in Australia , analysing the Australia detention rate vs the Tokyo MoU detention rate, per segment. The Most...
by ARA | Sep 6, 2024 | Uncategorized
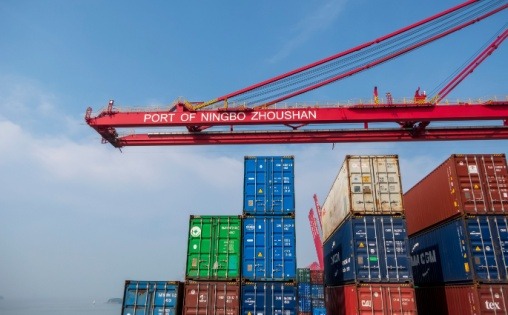
China PSC Scorecard L36M (Sep. 2021 – Aug. 2024) This RISK4SEA Report about China PSC Scorecard L36M (Sep. 2021 – Aug. 2024) includes key performance indicators (KPIs) , analysing the China detention rate vs the Tokyo MoU detention rate. The Most Common Detainable...
by ARA | Jul 31, 2024 | Uncategorized
Global PSC Detentions – H1 CY2024 This RISK4SEA Report about PSC Detentions globally for the 1st half of 2024 includes key figures and global PSC KPIs, the most common detainable deficiencies and ports with the most inspections per fleet segment. Key Figures...
by ARA | Jun 25, 2024 | Uncategorized
Tankers PSC Performance – CY2023 This RISK4SEA Report about Tankers PSC Performance for 2023 includes key figures of Calls and PSCIs (Ports with > 110 PSCIs), the top 5 Deficiency Codes and the Most Common PSC Deficiency codes. Key PSC Tankers Figures (CY2023) Key...
by ARA | Apr 11, 2024 | Uncategorized
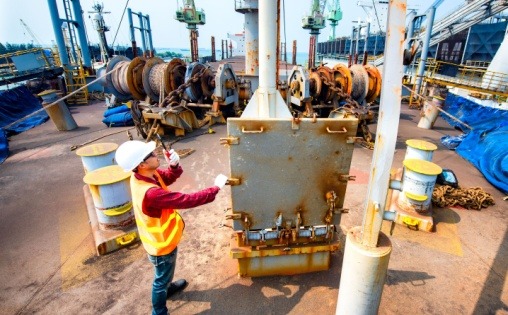
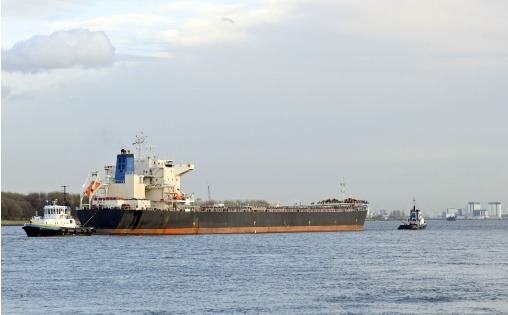
Australia – Capesize (>100k dwt) PSC Intelligence – CY2023 This RISK4SEA Report about PSC inspections for Capesize (>100k dwt) in Australia for 2023 includes breakdown of key figures of Calls and PSC Inspections and the Most Common Deficiency codes. Key PSC...