by ARA | Apr 18, 2023 | Uncategorized
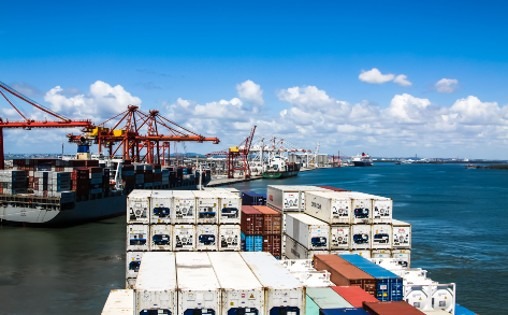
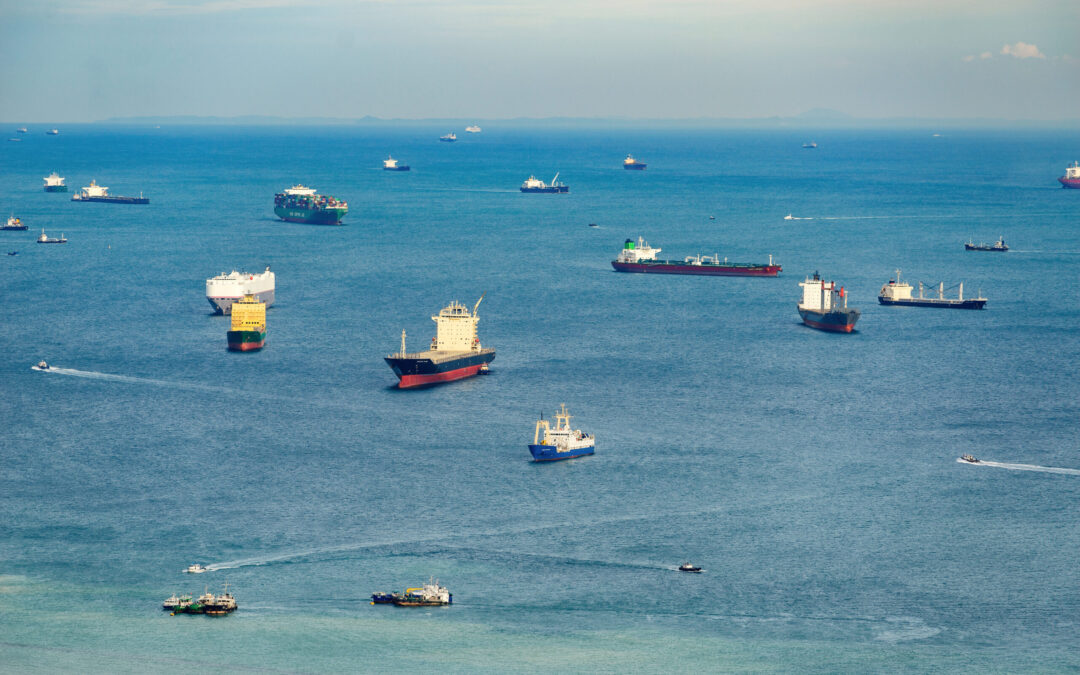
PSC Highlights for Ports 2022 This RISK4SEA Report about PSC Highlights for Ports 2022 includes ports with high number of inspections and zero detentions per fleet segment. Key Figures (CY 2022) Global KPIs Ports with Highest Number of Inspections per Fleet Segment...
by ARA | Mar 7, 2023 | Uncategorized
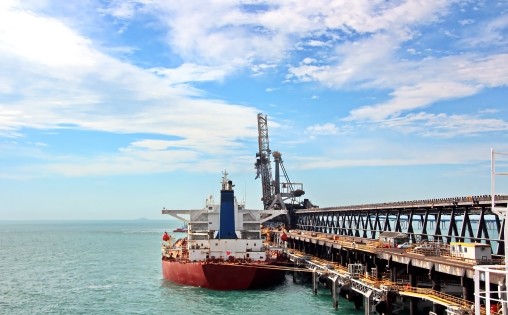
Australia – Capesize (>100k dwt) PSC Intelligence – CY2022 Australia is an area with high rate of dry cargo trading conducted by Capesize bulk carriers which are large-sized bulk carriers typically above 100,000 deadweight tonnage (DWT). Such ships cannot transit the...
by ARA | Feb 6, 2023 | Uncategorized
Global PSC Detentions – CY2022 This RISK4SEA Report about PSC Detentions globally for 2022 includes global key PSC Figures and global Key Performance Indicators (KPIs), the Most Common Detainable Deficiency and the Ports with most Inspections per Fleet Segment....
by ARA | Jan 9, 2023 | Uncategorized
Global PSC – Most Common Deficiency Codes L36M (Dec. 2019 – Nov. 2022) This RISK4SEA Report about most common deficiency codes for PSC inspections globally for the last 36 months (Dec. 2019 – Nov. 2022) includes deficiency code spread along with many insights. Key...
by ARA | Dec 6, 2022 | Uncategorized
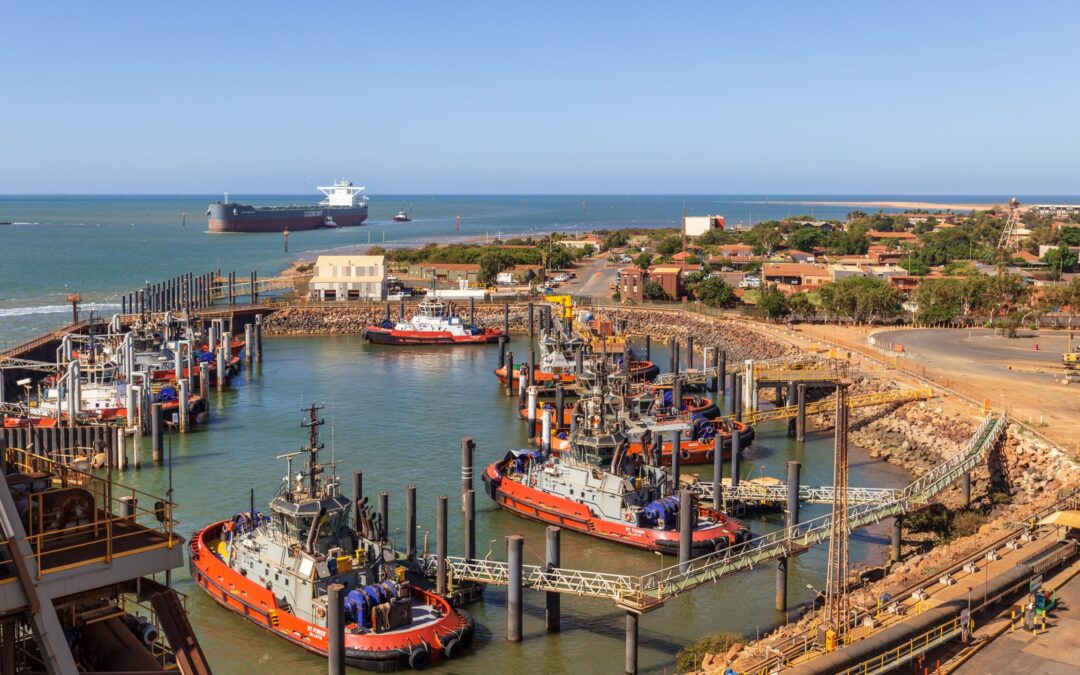
Port Hedland PSC Highlights Capesize L36M (Nov. 2019 – Oct. 2022) This RISK4SEA Report about PSC Inspections Highlights for Capesize in Port Hedland for the last 36 months (Nov. 2019 – Oct. 2022) includes unique inspections vs unique calls &...
by ARA | Nov 9, 2022 | Uncategorized
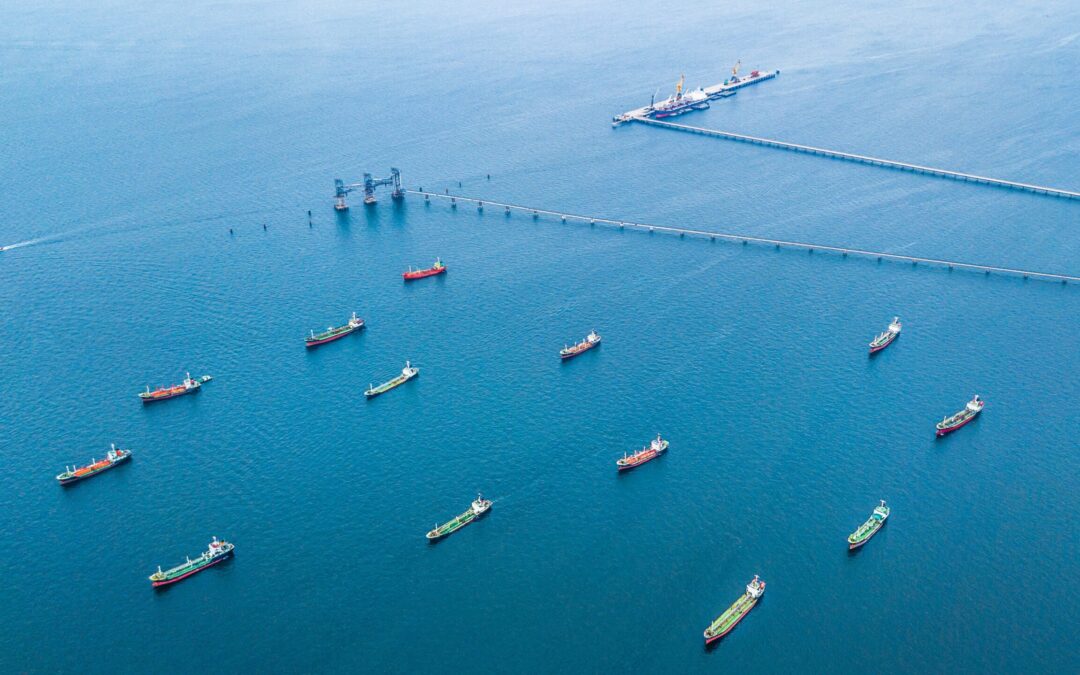
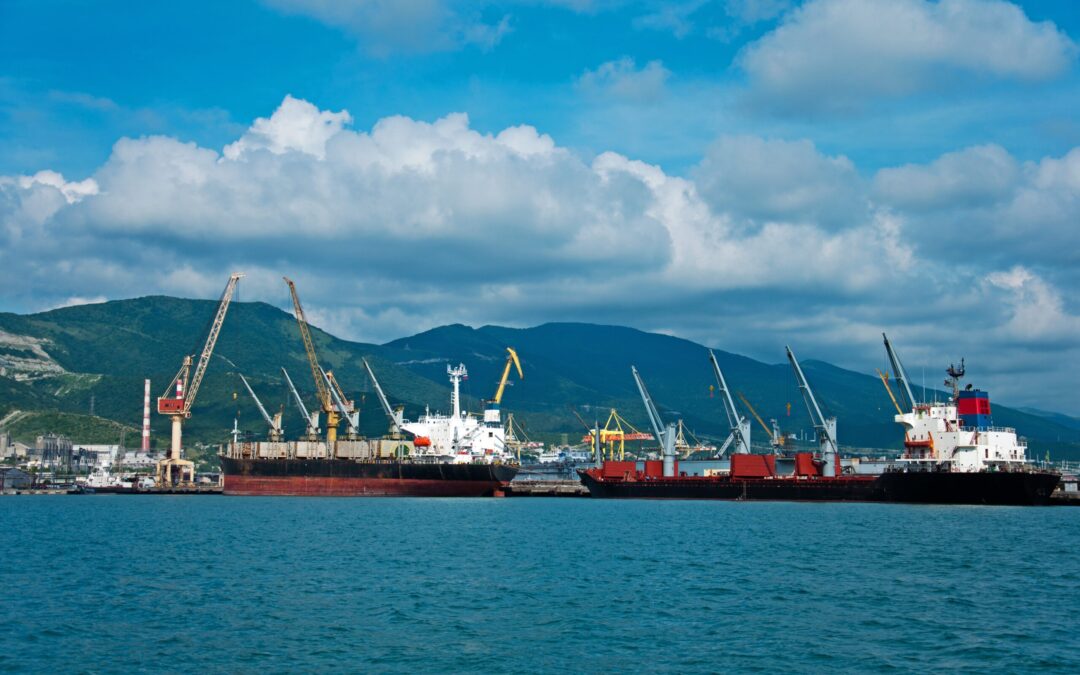
Novorossiysk PSC Scorecard L6M (Apr. 2022 – Sep. 2022) This RISK4SEA Scorecard about PSC inspections in Novorossiysk for the last 6 months (Apr. 2022 – Sep. 2022), includes unique inspections vs unique calls and the most common deficiencies per fleet...