by ARA | Jul 6, 2022 | Uncategorized
Global PSC – Most Common Deficiency Codes – CY2021 This RISK4SEA Report about Most Common Deficiency Codes for PSC inspections globally for 2021 includes deficiency code spread. Key figures Global KPIs Deficiency Code Spread The 10% (9300 deficiencies) of...
by ARA | Jul 6, 2022 | Uncategorized
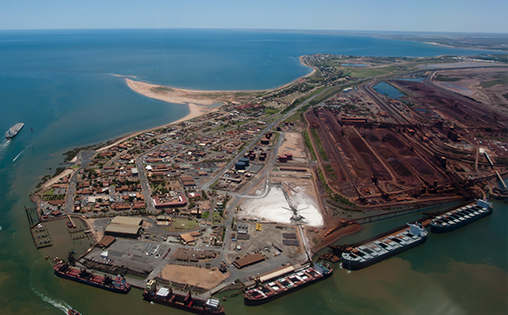
Port Hedland PSC Inspections vs Calls – 2021 Overview This RISK4SEA Report about PSC Inspections vs Calls in Port Hedland for 2021 includes ship type & age detention analysis, ships inspected vs ships called and top 5 deficiency codes. Key figures PSC KPIs...
by ARA | Jul 6, 2022 | Uncategorized
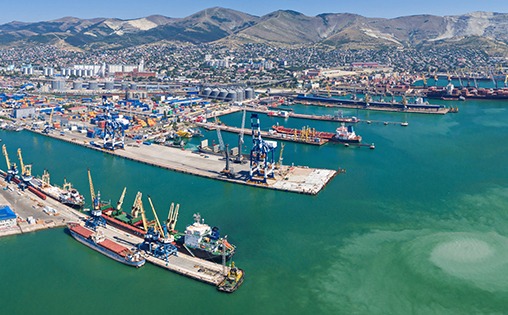
Novorossiysk PSC Inspections vs Calls – 2021 1st Semester This RISK4SEA Report about PSC Inspections vs Calls in Novorossiysk for the 1st Semester 2021 includes ship type & age detention analysis, ships inspected vs ships called and top 5 deficiency codes. Key...

by ARA | Jul 6, 2022 | Uncategorized
Global PSC Detentions – Q3 CY2021 This RISK4SEA Report about PSC inspections globally for the Q3 of 2021 includes detentions per manager base country, detainable deficiencies areas, ship type & age detention analysis, detention rate vs ship age and top...
by ARA | Jul 6, 2022 | Uncategorized
China – Bulk Carriers Deficiency Code Ranking L12M (Sep. 2020 – Aug. 2021) This RISK4SEA Report about Deficiency Code Ranking for Bulk Carriers in China for the last 12 months (Sep. 2020 – Aug. 2021) includes top 20 ranked deficiency codes and highlights. ...

by ARA | Jul 5, 2022 | Uncategorized
Global Capesize PSC Analytics L12M (Aug. 2020 – Aug. 2021) This RISK4SEA Report about PSC inspections for Capesize globally for the last 12 months (Aug. 2020- Aug. 2021) includes age group share in PSC results, most challenging ports, most common deficiency...