by ARA | Jul 5, 2022 | Uncategorized
Black Sea MoU PSC Scorecard 2020 This RISK4SEA Report about Black Sea MoU PSC scorecard for 2020 includes ship type & age analysis, detention rate vs ship age, ship age and group performance, detentions per nanager base country, MoU most busiest ports, most common...
by ARA | Jul 5, 2022 | Uncategorized
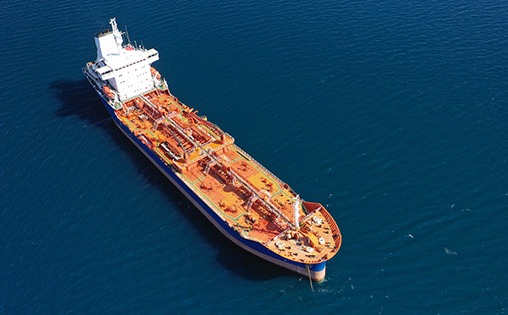
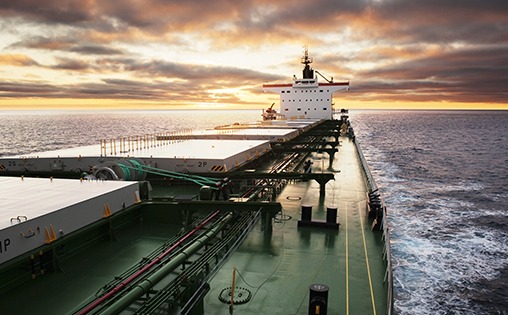
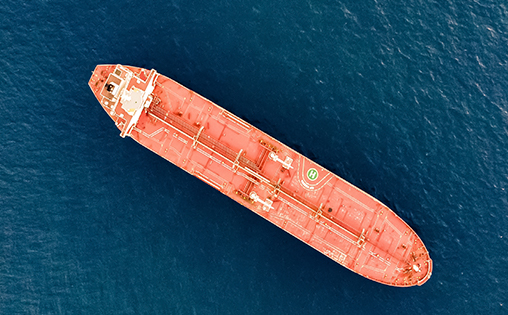
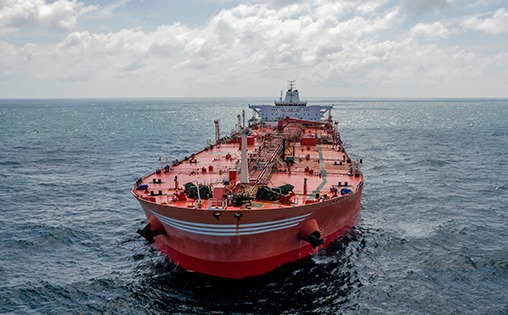
Comparison of Tankers’ PSC Analytics (2016-2020) Carriage of oil / gas / fuel or other liquified products is the “blood” of global economy. Tankers, the ships dedicated to transfer such cargoes, are mainly divided in three segments:All Tankers: Carrying liquified...
by ARA | Jul 5, 2022 | Uncategorized
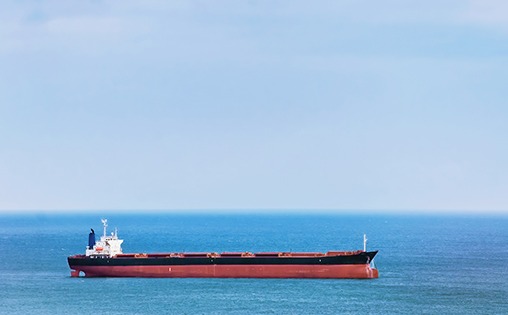
AMSA – Capesize PSC Analytics 2020 Australia is an area with high rate of dry cargo trading conducted by Capesize bulk carriers. Capesize are large-sized bulk carriers typically above 150,000 deadweight tonnage (DWT). The name is due to reason that such ships...
by ARA | Jul 5, 2022 | Uncategorized
Global PSC Detentions – Q1 CY2021 This RISK4SEA Report about PSC detentions globally for the Q1 of 2021 includes breakdown of detentions per manager base country, most common detainable deficiencies, detention rate (DER) vs ship age and top ports with high...
by ARA | Jul 5, 2022 | Uncategorized
PSC Highlights for Ports 2020 This RISK4SEA Report about PSC Highlights for Ports 2020 includes ports with high number of inspections and most common detainable deficiencies in global ports per ship type. Key figures PSC KPIs Top Ports with High Number of Inspections...
by ARA | Jul 5, 2022 | Uncategorized
Tokyo MoU PSC Scorecard 2020 This RISK4SEA Report about PSC inspections in Tokyo MoU for 2020 includes ship type & age analysis, detention rate vs ship age, detentions per nanager base country, ports with most inspections, most common deficiency codes and the most...