PSC Benchmarking Methodology

Objectives of a PSC Benchmarking Methodology
To develop a fair system, you need to make sure you compare apples to apples and oranges with oranges, and when it comes to shipping this means comparing ships of the:
- Same Type
- Same Fleet Segment (DWT Wise)
- Same Year of Built (YoB)
- Same performance on Same Port
We have applied these principles consistently, throughout the platform to make sure everyone is treated fairly.
Splitting the Global Fleet into Segments
Benchmarking may be impossible unless you split the global fleet into segments, that we have employed as follows:
- Bulker – Handysize (<35k DWT)
- Bulker – Handymax (35-50k DWT)
- Bulker – Supramax (50-67k DWT)
- Bulker – Panamax (67-100k DWT)
- Bulker – Cape (>100k DWT)
- Bundle: All dry bulk (Segments 1, 2, 3, 4,5)
- General Cargo
- Tanker – Small Product (<25k DWT)
- Tanker – MR1/MR2 (25 – 60k DWT)
- Tanker – LR1/LR2 (60-125k DWT)
- Tanker – Suezmax (125-200k DWT)
- Tanker – VLCC (>200k DWT)
- Bundle: All tankers (Segments 8,9,10,11,12)
- LNG/Gas Carriers
- LPG Carrier
- Container – Feeders (<10k DWT)
- Container – Large (10-90k DWT)
- Container – Ultra Large (>90k DWT)
- Bundle: All containers (Segments 16, 17, 18)
- Vehicle Carrier
- Ro Pax
- Offshore
- Other Ship Type
- Bundle: All ships (All above segments)
Making Sure what we count makes sense
We count for deviations from the assigned benchmark on two (2) parameters mainly
- ·The Deficiency per Inspection (DPI), i.e. Number of Deficiencies / Number of Inspections for a given period
- The Detention Rate (DER), i.e. Number of Detentions / Number of Inspections x 100 for a given period
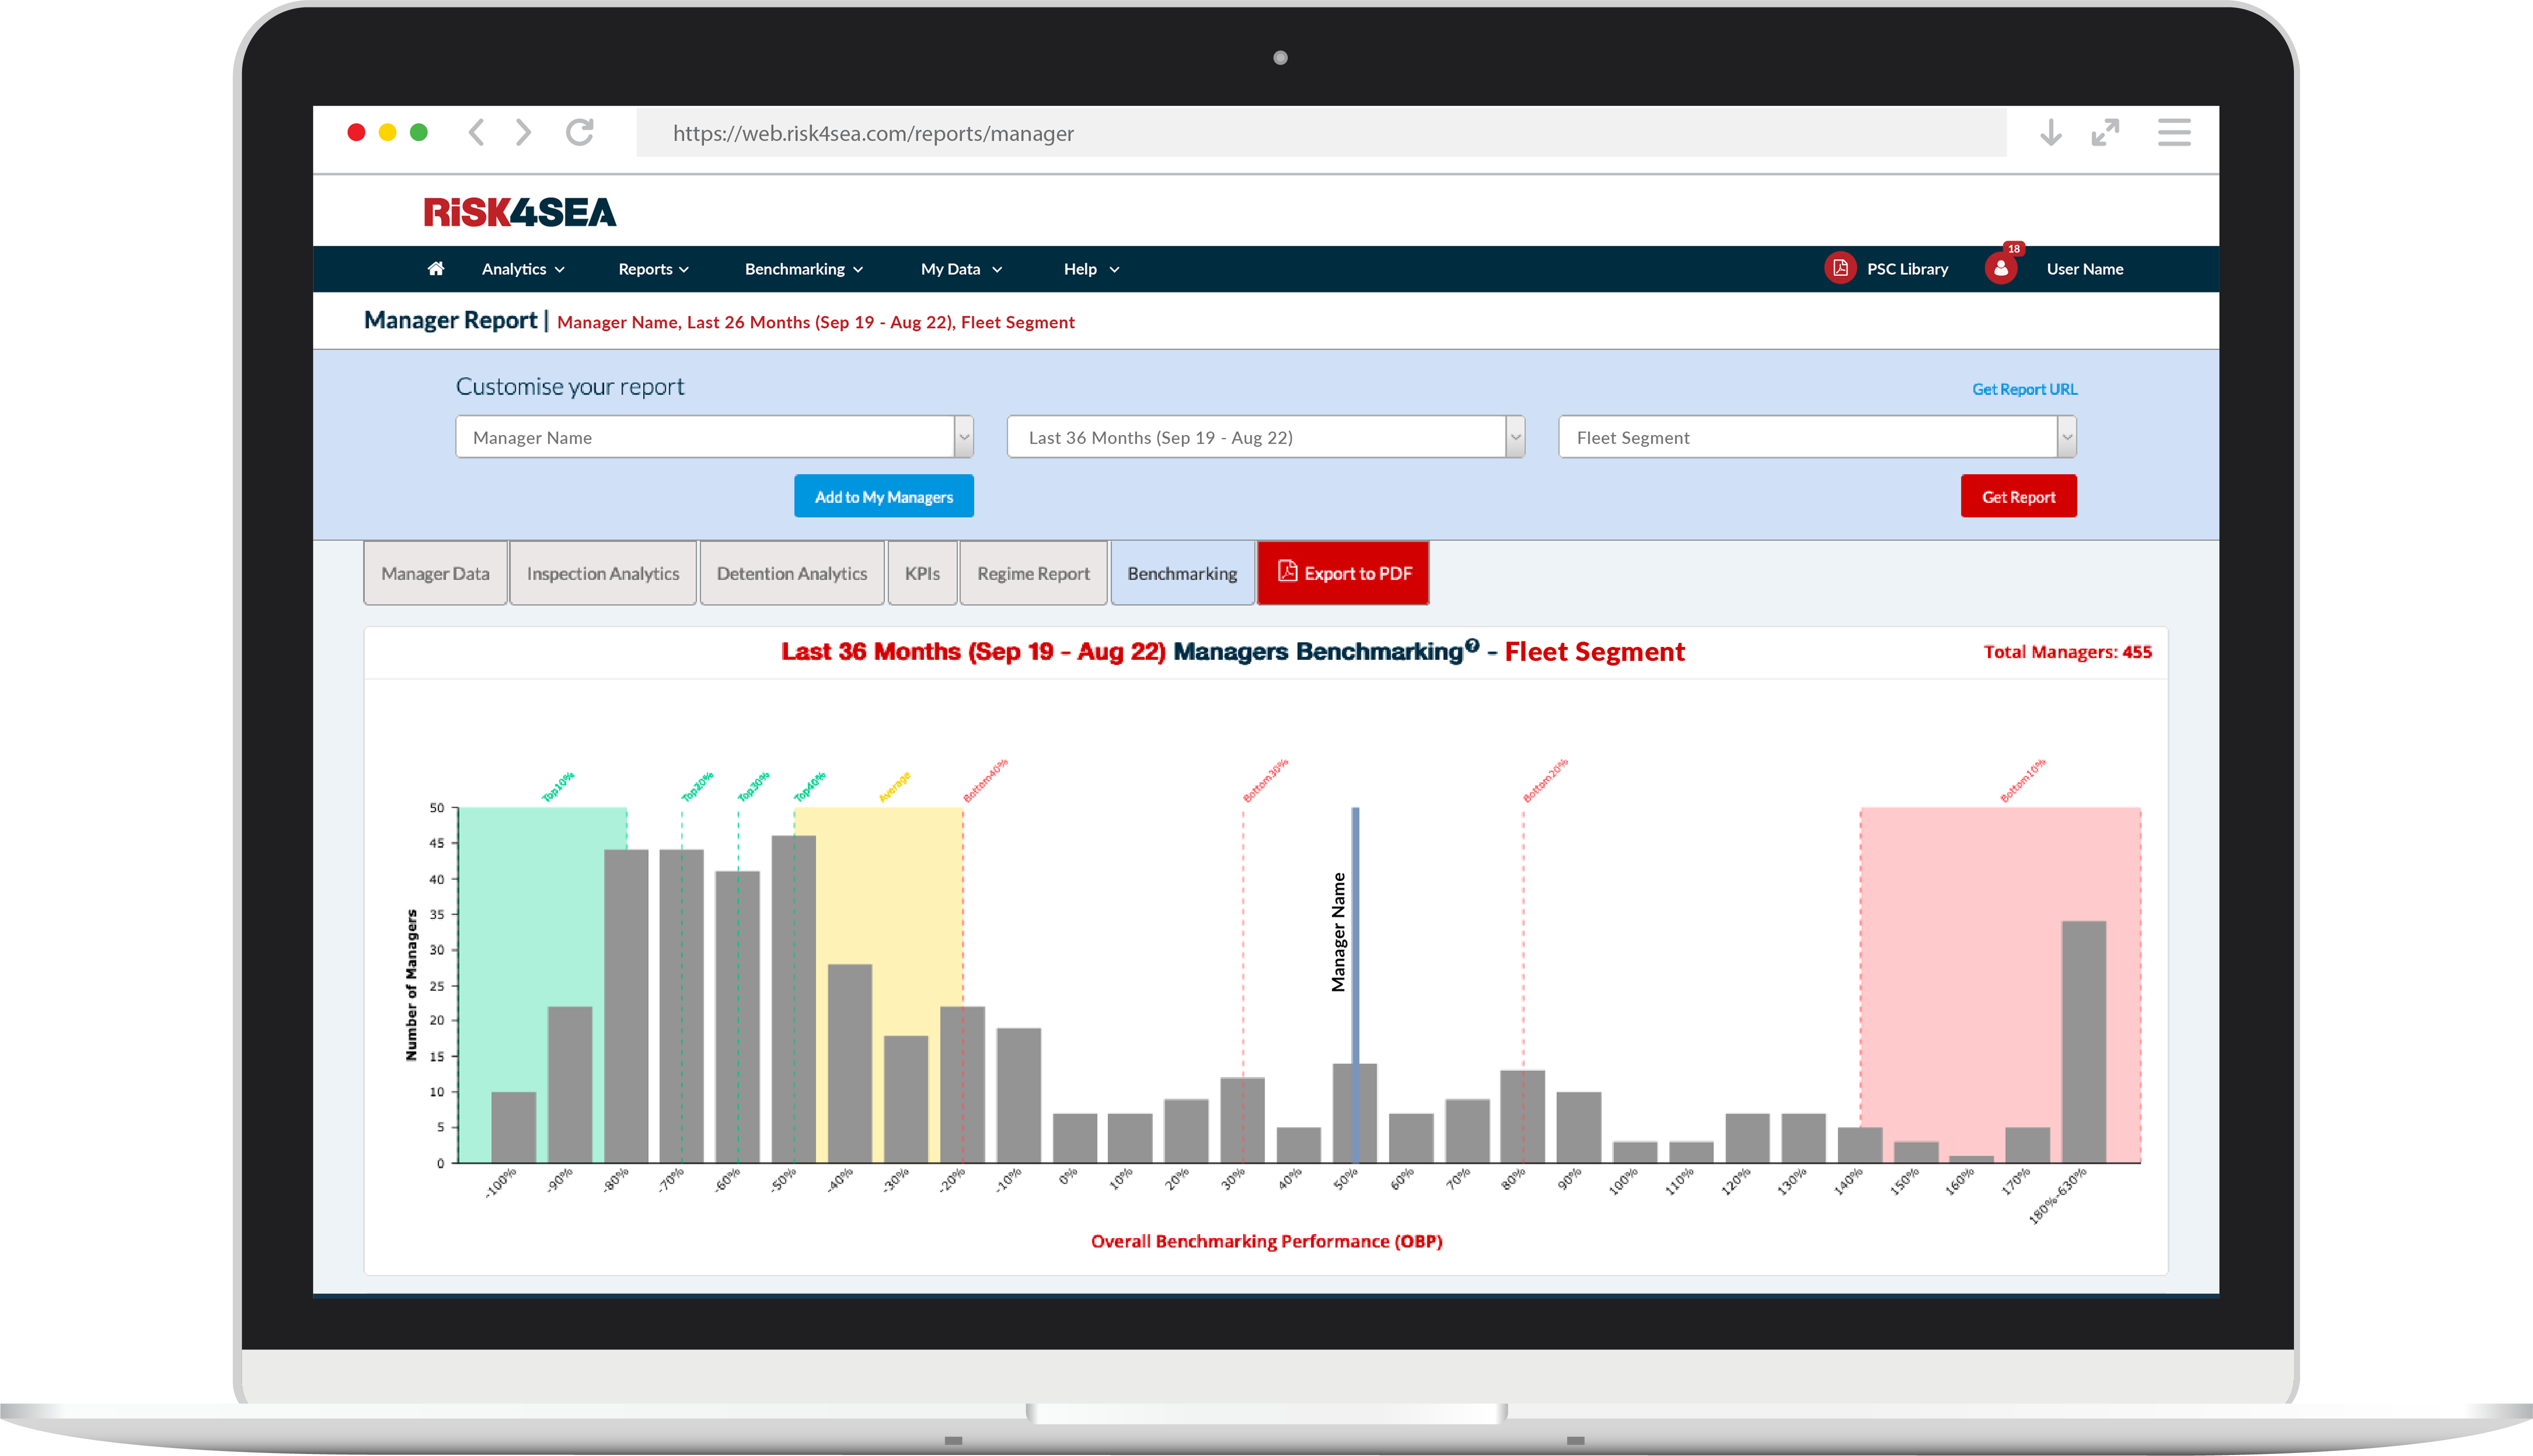
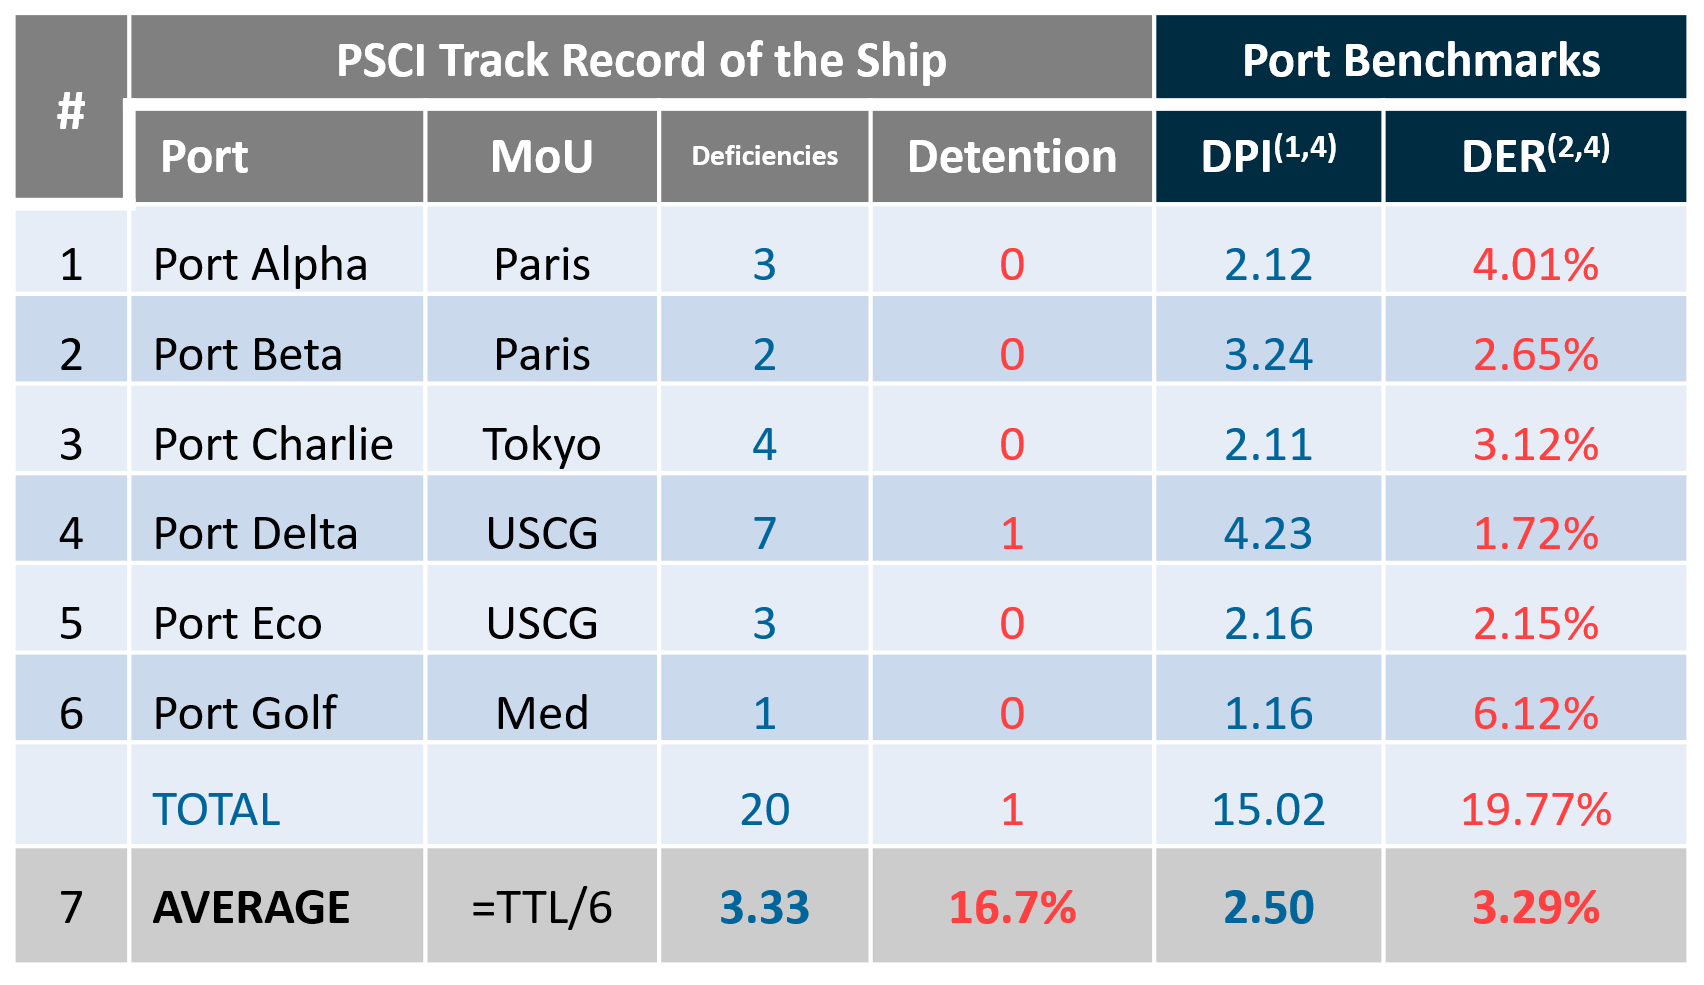
For every Ship there is a benchmark that is provided by the AVERAGE performance of the same ship YoB, Fleet Segment and Port that is calculated for a given period, as per the example below
The Deviation is the % of the deviation of actual performance vs the Benchmark (which is the average) x 100
How we calculate the Performance with a worked example
This is a Ship Benchmarking Example for Ship Z, on the Cape Fleet Segment, with YoB: 2010).
This is the actual performance of the ship for the period under investigation:

Calculation for the above example:
DPI Benchmark: (3.33 – 2.50)/2.50 x100% = +33.2% | DER Benchmark : (16.7 – 3.29)/3.29 x100%= +407.6%
Overall Benchmark Performance for the Period as the average Benchmark of DPI/DER = (33.2 + 407.6) /2 = +220.1%
Following remarks apply:
- DPI: Deficiencies Per Inspection
- DER: Detention Rate per 100 inspections
- BEP: Benchmarking Performance
- Port Benchmarks are for same Port, Fleet Segment (cape) & Age (YOB=2010) and then calculated/adjusted per ship
- Fleet Benchmarks are calculated on the basis of sums/averages of Ship Inspections & Benchmarks
- Comparing DPIs and DER the smallest number is beating the competition, therefore the smaller the value below zero the better the performance
- Overperforming means Beating the average, e.g BEP=-13%
- Underperforming means Exceeding the average, e.g BEP=+13%
Experience it Firsthand
- Please review the most challenging ports in selected segments
- Please review the Best Performers in a number of selected segments & regimes
Dive Deeper
Principles of the RISK4SEA Platform

PSC Intelligence
Powered by PSC Inspections
We host the largest and most comprehensive PSC intelligence database, going beyond just PSCIs and deficiencies. Our platform offers deep insights into actual inspections, from calculating PSCI windows for every port call to generating tailored checklists for specific ports, ships, and managers—ensuring everything is prepared efficiently and effectively.

PSC KPIs
Explore DPI, DER & KPIs vs Ship Age on specific Ports
Challenging Ports
Take a deep dive into the most challenging ports
POCRA
Get POCRA for your Ship @ next port of Call with Real Data
Best Performers
Find the top performers on each fleet segment
PSC WiKi
Explore & learn from the latest PSC Procedures
