Novorossiysk PSC Scorecard L36M (Nov. 2020 – Oct. 2023)
This RISK4SEA Report about PSC inspections in Novorossiysk for the last 36 months (Nov. 2020 – Oct. 2023) includes Novorossiysk vs Black Sea MoU Detention Rate (DER) and the most common detainable deficiencies per fleet segment.
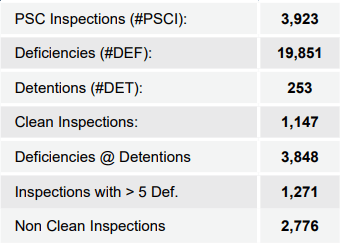
Key PSC Figures in Novorossiysk

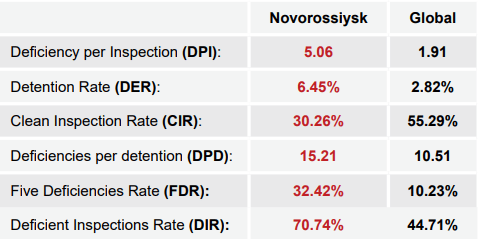
Key Performance Indicators (KPI)

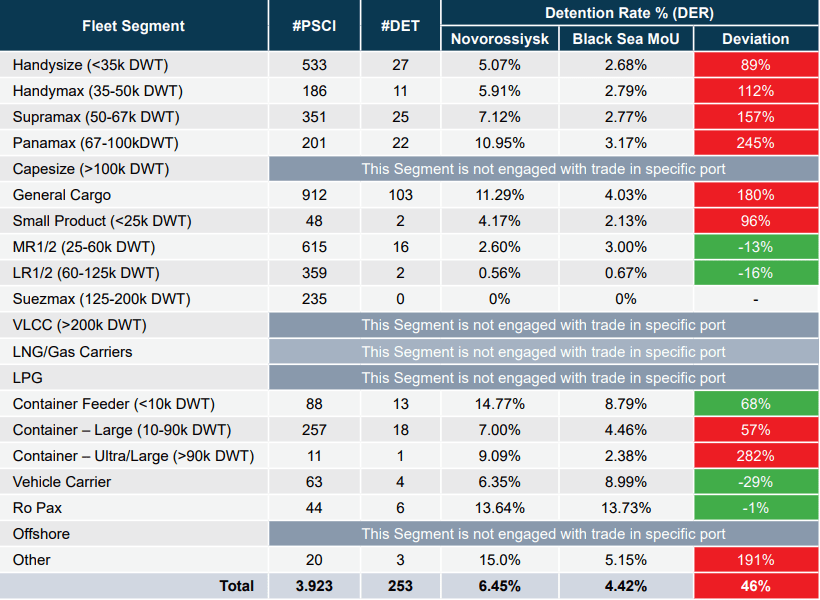
Novorossiysk Detention Rate (DER) vs Black Sea MoU DER, per Segment

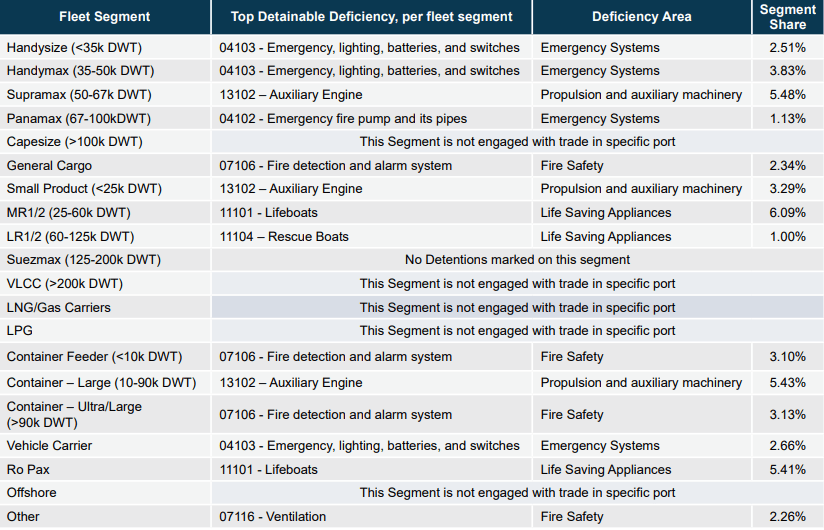
Most Common Detainable Deficiency, per fleet segment

Highlights
- Novorossiysk is the most visited port in Black Sea MoU Region. It is a rather strict port as Port DER is 46% higher than Black Sea MoU overall.
- Almost all fleet segments mark Detention Rates higher than Black Sea MoU Average (Only MR1/2, LR1/2, Vehicle and Ro Pax have Lower figures).
- Most detainable deficiencies vary in different segments and cover mostly the areas of Emergency Systems, Fire Safety, Propulsion and LSA varying from segment to segment.
About RISK4SEA | www.risk4sea.com | Client List https://bit.ly/3L4ulcI
RISK4SEA is a SaaS PSC Intelligence platform, illuminating PSC performance to Prepare/Assess PSC inspections, Benchmark against competition and Automate PSC functions and alerts to eliminate detentions and minimize OPEX.