INSIGHTS
Primary PSC KPIs (DPI/DER) for H1 2024
RISK4SEA is announcing the Primary Port State Control Key Performance Indicators (PSC KPIs) for the period of the H1 2024 with the objective to illuminate PSC performance across the major PSC regimes.
Tankers PSC Performance – CY2023
This RISK4SEA Report about Tankers PSC Performance for 2023 includes key figures of Calls and PSCIs (Ports with > 110 PSCIs), the top 5 Deficiency Codes and the Most Common PSC Deficiency codes.
Primary PSC KPIs (DPI/DER) for Q1 2024
RISK4SEA is announcing the Primary Port State Control Key Performance Indicators (PSC KPIs) for the period of the Q1 2024 with the objective to illuminate PSC performance across the major PSC regimes.
Australia – Capesize (>100k dwt) PSC Intelligence – CY2023
This RISK4SEA Report about PSC inspections for Capesize (>100k dwt) in Australia for 2023 includes breakdown of key figures of Calls and PSC Inspections and the Most Common Deficiency codes.

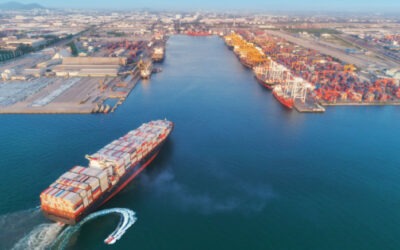
Singapore PSC Scorecard – CY2023
This RISK4SEA Report about PSC inspections in Singapore for 2023 includes the Singapore vs Tokyo MoU Detention rate per segment, the Top 20 Detainable Deficiency Codes Ranking and some important PSC Highlights.
Global PSC Detentions – CY2023
This RISK4SEA Report about PSC Detentions globally for 2023 includes global key PSC Figures and global Key Performance Indicators (KPIs), the Most Common Detainable Deficiency and the Ports with most Inspections per Fleet Segment.

Primary PSC KPIs (DPI/DER) for the CY 2023
RISK4SEA is announcing the Primary Port State Control Key Performance Indicators (PSC KPIs) for the period of the Calendar year 2023 with the objective to illuminate PSC performance across the major PSC regimes.
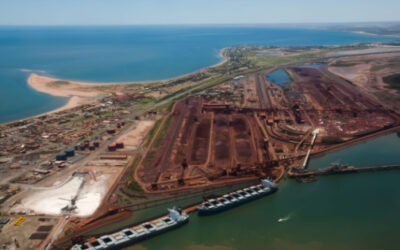
Port Hedland PSC Highlights Capesize L36M (Dec. 2020 – Nov. 2023)
This RISK4SEA Report about PSC Inspections Highlights for Capesize in Port Hedland for the last 36 months (Dec. 2020 – Nov. 2023) includes Unique inspections vs Unique calls & Re-inspections, the Port Hedland deficiency code profile and a PSC highlight about a Capesize vessel along with Key findings.

Novorossiysk PSC Scorecard L36M (Nov. 2020 – Oct. 2023)
This RISK4SEA Report about PSC inspections in Novorossiysk for the last 36 months (Nov. 2020 – Oct. 2023) includes Novorossiysk vs Black Sea MoU Detention Rate (DER) and the most common detainable deficiencies per fleet segment.

Final results and Fire Safety CiC intensity Index (September-November Data)
The Concentrated Inspection Campaign (CiC), lasting from 1st September 2023 to 30th November 2023 aimed to verify compliance with the Fire Safety implementation on board ships. RISK4SEA provides final results and intensity Index for the entire CiC period.

Preliminary results and Fire Safety CiC intensity Index (September-October Data)
The Concentrated Inspection Campaign (CiC), lasting from 1st September 2023 to 30th November 2023. aims to verify compliance with the Fire Safety implementation on board ships. RISK4SEA provides preliminary results and intensity Index for September – October Data.

Preliminary results and Fire Safety CiC intensity Index (September Data)
The Concentrated Inspection Campaign (CiC), lasting from 1st September 2023 to 30th November 2023. aims to verify compliance with the Fire Safety implementation on board ships. RISK4SEA provides preliminary results and intensity Index for September Data.
Australia PSC Scorecard L36M (Oct. 2020 – Sep. 2023)
This RISK4SEA Report about PSC inspections in Australia for the last 6 months (Oct. 2020 – Sep. 2023) includes Australia vs Tokyo MoU Detention Rate (DER) and the most common detainable deficiencies per fleet segment.

Primary PSC KPIs (DPI/DER) for YTD 2023 (JAN 23-SEP 23)
RISK4SEA is announcing the Primary Port State Control Key Performance Indicators (PSC KPIs) for the period of January to September 2023 with the objective to illuminate PSC performance across the major PSC regimes.
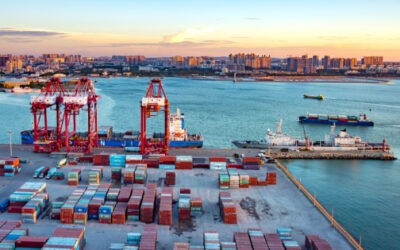
China PSC Scorecard L36M (Sep. 2020 – Aug. 2023)
This RISK4SEA Report about PSC inspections in China for the last 6 months (Sep. 2020 – Aug. 2023) includes China vs Tokyo MoU Detention Rate (DER) and the most common detainable deficiencies per fleet segment.

Global PSC Detentions – Η1 CY2023
This RISK4SEA Report about PSC Detentions globally for the 1st half of 2023 includes key figures and global PSC KPIs, the most common detainable deficiencies and ports with the most inspections per fleet segment.
PSC Best Performing Ships L36M (Jul. 2020 – Jun. 2023)
This RISK4SEA Report about Best Performing Ships in PSC inspections for the last 36 months (Jul. 2020 – Jun. 2023) includes the best performing ships per fleet segment showcasing the inspections and detentions in each category and PSC statistics with key figures and global KPIs.

Primary PSC KPIs (DPI/DER) for H1 2023
RISK4SEA is announcing the Primary Port State Control Key Performance Indicators (PSC KPIs) for the period of the H1 2023 with the objective to illuminate PSC performance across the major PSC regimes.

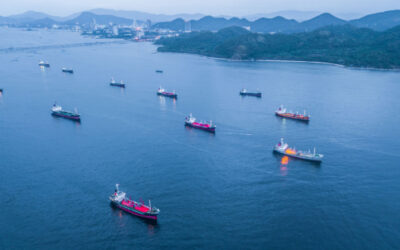
LNG PSC Analytics (2020-2022)
This RISK4SEA Report about LNG PSC Analytics (2020-2022) includes Inspection Data and PSC KPIs for LNG Carriers, a list of Detainable Deficiencies, ports that the LNG Detentions occurred and 30 top visited ports for LNG/Gas Carriers.

Primary PSC KPIs (DPI/DER) for Q1 2023
RISK4SEA is announcing the Primary Port State Control Key Performance Indicators (PSC KPIs) for the period of the Q1 2023 with the objective to illuminate PSC performance across the major PSC regimes.