Methodology
NAVIGATE WISELY
PSC Performance Key Performance Indicators (KPIs)
Deficiencies per Inspection (DPI)
Predicted Deficiency Index (PDI)
Human Factors & Crewing mDPI (HFC mDPI)
Regulatory & Operational Compliance mDPI (ROC mDPI)
Ship Structure & Equipment mDPI (SSE mDPI)
PSC Performance Key Performance Indicators (KPIs)
Deficiencies per Inspection (DPI)
What We Measure & What it stands for
The average number of deficiencies per PSCI recorded for a ship or a set of PSCIs for a fleet.
DPI reflects the overall compliance health of a vessel or fleet.
- Lower DPI = Less Deficiencies on average = Better compliance
- Higher DPI = More frequent findings, Less compliance, more possible weaknesses
Why It’s Important
- DPI is a leading indicator for PSC underperformance, repeat findings, and PSC targeting.
- Used by MoUs and vetting bodies as a proxy for safety performance.
Real Life Interpretation (So What?)
- DPI Performance < Average, i.e. Less than 50%: Ship/Fleet is underperforming; immediate further review, root cause analysis and corrective /preventive action plan required.
- If DPI Performance improves over time: Evidence of effective implementation and reduced commercial risk.
- DPI = 0: Strong competitive advantage in vetting and chartering.
Methodology & Formula
DPI Box (below DPI text at the snapshot): #Deficiencies / # PSCIs
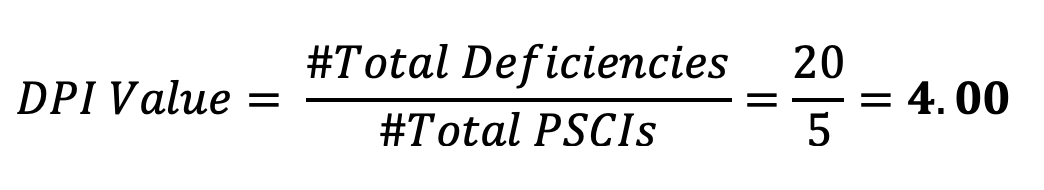
DPI Value: Number of Deficencies / Number of PSCIs
DPI Benchmark: Average Number of Deficencies / Number of PSCIs for the specific port or set of ports that the ship (or fleet) has recorded PSCIs (same ship type, last 36 months averages), as calculated on the PSCI History.
DPI Performance:
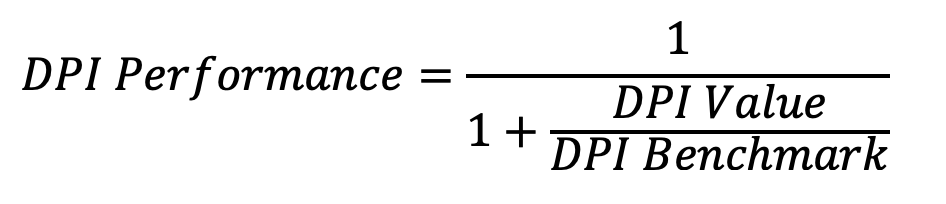
- 0% = Worst performance (far above benchmark)
- 50% = Average performance (value equal to benchmark)
- 100% = Best performance (DPI Value =0)
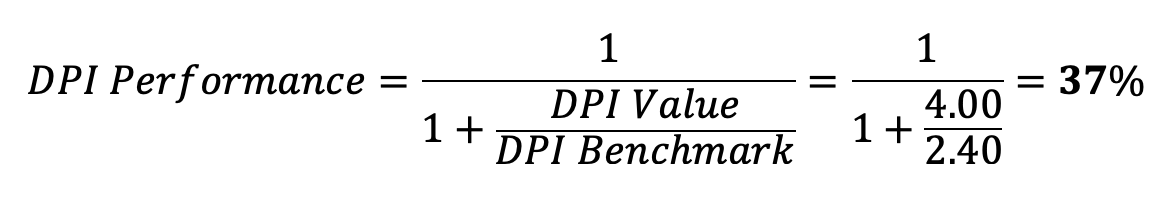
Worked Example
PSCIs = 5, Deficiencies = 20
DPI Box (below DPI text at the snapshot): 20/5
DPI Benchmark = 2.40 (Average for PSCIs at the same port, ship type, last 36 months)
Detention Rate (DER)
What We Measure & What it stands for
The percentage of PSCIs that resulted in a detention for a ship or a set of PSCIs for a fleet.
DER reflects the vessel’s ability to maintain compliance at a level that avoids detentions.
- Lower DER = Fewer detentions = Higher compliance and reliability
- Higher DER = Frequent detentions = Serious compliance gaps, operational risk, reputational damage
Why It’s Important
- A detention is the most severe outcome of a PSC inspection.
- DER is a critical KPI for MoUs, Flag States, vetting bodies, charterers, and insurers.
- A high DER directly affects the commercial acceptability of a vessel/fleet.
Real Life Interpretation (So What?)
- DER Performance < Average, i.e. Less than 50%: Ship/Fleet is underperforming; immediate further review, root cause analysis and corrective action and preventive action plan required.
- Consistently decreasing DER: Evidence of strong compliance culture, effective SMS implementation, and reduced commercial risk.
- DER = 0%: Strong competitive advantage in vetting and chartering.
Methodology & Formula
DER Box (below DER text at the snapshot) : #Detentions / # PSCIs
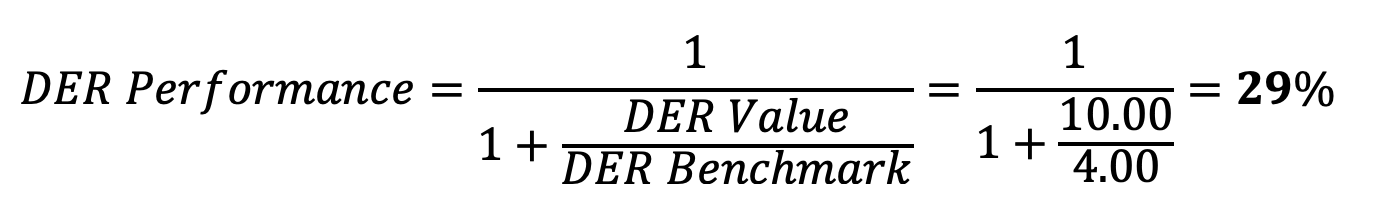
DER Value: DER= Number of Detentions / Number of PSCIs
DER Benchmark: Average Detention Rate for the specific set of PSCIs accounting for PSCIs at the same Port, Ship Type and Average Values for the Last 36 Months, as calculated on the PSCI History.
DER Performance:
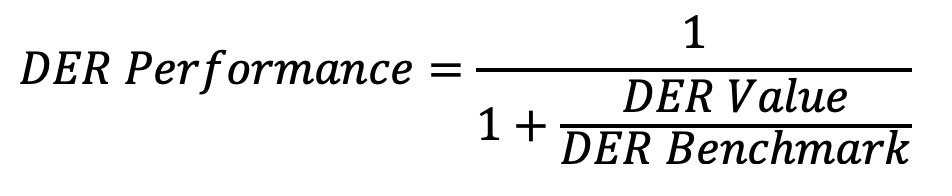
- 0% = Worst performance (far above benchmark)
- 50% = Average performance (value equal to benchmark)
- 100% = Best performance (DER Value =0)
Worked Example
PSCIs = 20
DER Box (below DER text at the snapshot): 2/20

DER Benchmark = 4.00 % (Average for PSCIs at the same port, ship type, last 36 months)
SMS Deficiency Rate (SDR)
What We Measure & What it stands for
The percentage of deficiencies related to the Safety Management System (The sum of Repeat deficiencies for the same Ship over the last 36 months and the Number of ISM Code – 15xxx codes) recorded during PSC inspections (PSCIs) for a ship or a fleet.
SDR reflects the ability of a vessel or fleet to maintain an effective Safety Management System (SMS).
- Lower SDR = Fewer SMS-related failures = Stronger SMS implementation & compliance/safety culture
- Higher SDR = Frequent SMS-related deficiencies = Weakness in SMS implementation and safety culture
Why It’s Important
- SDR is the leading KPIs for systemic issues because it doesn’t just measure technical gaps but also the strength of company SMS as monitored in real life onboard ships.
- This is by far the purest Leading Indicator of a possible SMS Failure, even before a Detention may occur
- SMS-related deficiencies are seen as systemic failures, not isolated events.
- They are often treated by PSC inspectors as leading indicators of safety risk and may increase targeting probability.
- A high SDR undermines confidence in the company’s SMS and can lead to detentions or commercial rejection.
Real Life Interpretation (So What?)
- SDR Performance < Average, i.e. Less than 50%: Indicates weak SMS implementation; requires immediate systematic review, root cause analysis and corrective action and preventive action plan required.
- Decreasing SDR over time: Demonstrates improved SMS implementation and safety culture.
- SDR close to 0%: Competitive advantage, signaling effective SMS implementation in all fronts.
Methodology & Formula
SMS Deficiencies = Number of Repeat Deficiencies within the same ship over the last 36 months + Number of ISM Deficiencies (All 15xxx codes)
SDR Box (below SDR text at the snapshot) : #SMS Deficiencies / # Total Deficiencies
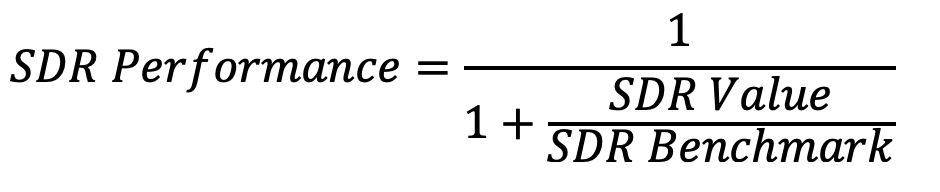
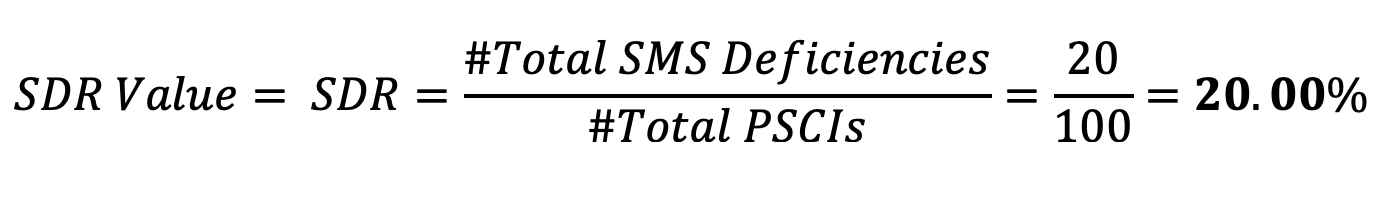
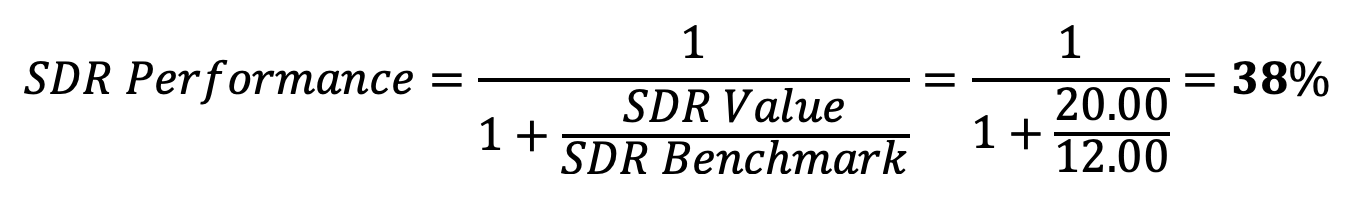
SDR Value: SDR= Number of SMS Deficiencies / Number of Total Deficiencies
SDR Benchmark: Average SMS Deficiencies Rate for the specific set of PSCIs accounting for PSCIs at the same Port, Ship Type and Average Values for the Last 36 Months as calculated on the PSCI History.
SDR Performance:
- 0% = Worst performance (far above benchmark)
- 50% = Average performance (value equal to benchmark)
- 100% = Best performance (SDR Value =0)
Worked Example
Total PSCIs = 100
Total Repeat deficiencies = 14
Total ISM (15xxx) deficiencies = 6
SMS Deficiencies (Repeat+ ISM) = 20
SDR Box: 20/100
SDR Benchmark = 12.00 % (Average for PSCIs at the same port, ship type, last 36 months)
Predicted Deficiency Index (PDI)
What We Measure & What it stands for
The number of deficiencies recorded during an actual PSCI that are considered predicable and therefore have been included in the PSC Preparation Checklist that may be provided to a ship before hand (if they were using the RISK4SEA POCRA and POCRA Checklist).
A Deficiency may be considered Predictable on the following occasions ahead of a PSCI:
- A deficiency has been recorded as a detainable (even once) in the port for the ship type over the last 36 months
- A deficiency is included as related to CiC in a port where a CiC is in effect at the time of PSCI
- A deficiency has an occurrence rate>1% in the port for the ship type over the last 36 months
This is a severity weighted Index accounting detainable deficiencies with increased severity so that a single index is produced properly reflecting what happened.
PDI is a Leading Indicator and it may be interpreted in two ways.
- If the Ship has been provided with a POCRA Checklist, how good they read the checklist and implemented the actions due
- If the Ship has not been provided with a POCRA Checklist how predictable were the actual recorded deficiencies
- Lower PDI = Better Implementation of the Checklist
- Higher PDI = Not good implementation of the Checklist (assuming one provided)
Why It’s Important
- PDI is a unique predictive KPI within RISK4SEA — it turns compliance monitoring from reactive to proactive.
- PDI is forward-looking – unlike DPI, which is historical, reflecting how teams respond on the checklist.
- Helps ship & office teams prepare proactively before an upcoming port call.
- Enables prioritization of resources, checklists, and corrective actions for vessels at higher risk.
- Signals a reduced likelihood of surprise detentions.
Real Life Interpretation (So What?)
- PDI Performance < Average, i.e. Less than 50%: Ship is underperforming compared to peers; they either not paying attention, reading or implementing the checklist in a proper manner compared with peers and further actions should be considered.
- If PDI decreases over time: Demonstrates positive improvements, better reading and implementation of the Checklist, meaning actions planned are effective.
- PDI ≈ 0: Excellent status, PSCIs are recorded with minor findingsm reading and implementation of checklist is excellent, minimal or very low PSC exposure risk.
Methodology & Formula
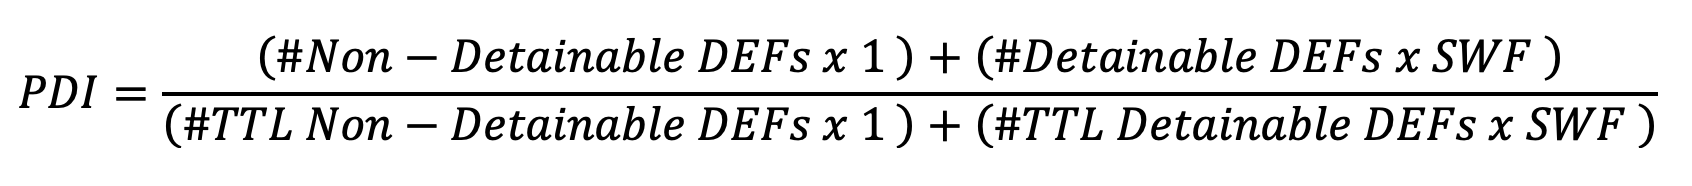
Where SWF = Severity Weighted Factor = 10, i.e. a detainable deficiency is 10 times more important than a non detainable one
PDI Benchmark: Average PDI for the specific set of PSCIs accounting for PSCIs at the same Port, Ship Type and Average Values for the Last 36 Months as calculated on the PSCI History.
PDI Performance:
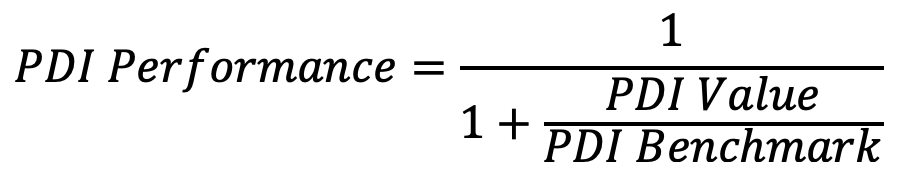
- 0% = Worst performance (far above benchmark)
- 50% = Average performance (value equal to benchmark)
- 100% = Best performance (PDI Value =0)
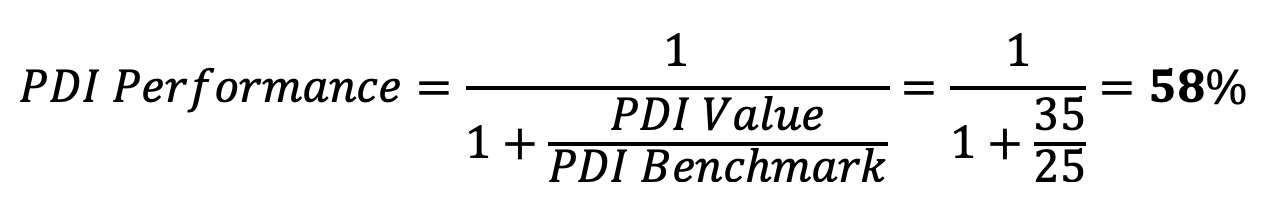
Worked Example
Non-Detainable Deficiencies: 3 predicted out of 7 recorded in total
Detainable Deficiencies: 1 predicted out of 3 recorded in total
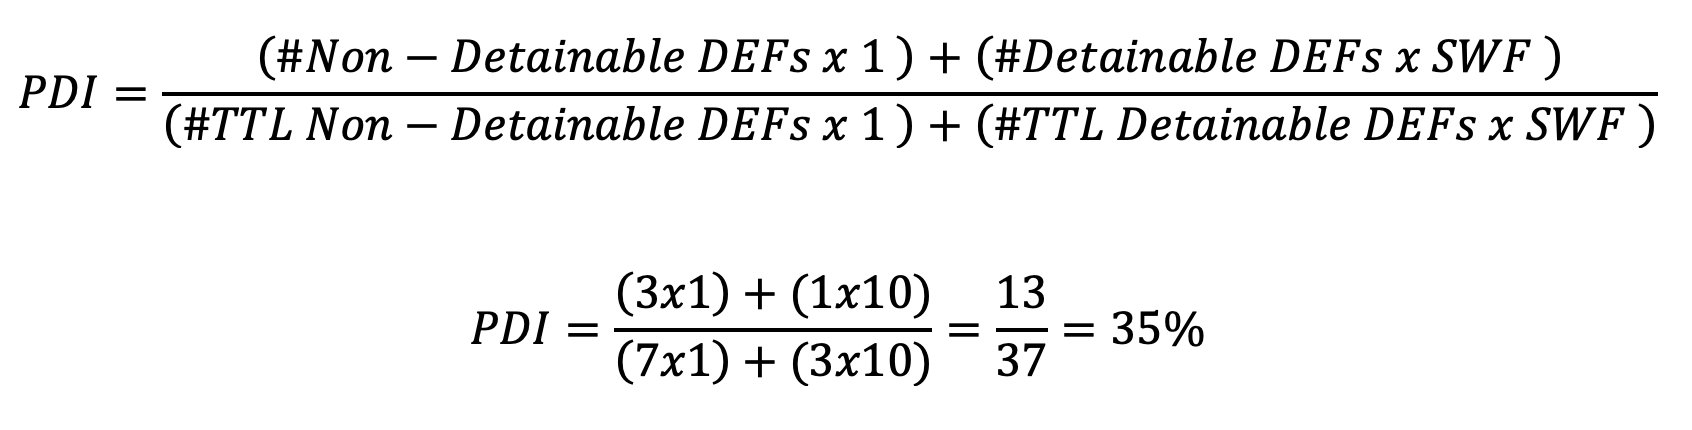
PDI Benchmark = 25% (Average for same port, ship type, last 36 months)
Human Factors & Crewing mDPI (HFC mDPI)
What We Measure & What it stands for
The average number of deficiencies per PSC inspection (PSCI) that are related to human factors and crewing issues (e.g., certificates, competence, drills, working/rest hours, living conditions, MLC compliance).
HFC DPI reflects the crew readiness and human element compliance of a vessel or fleet.
- Lower HFC DPI = Fewer crew-related deficiencies = Higher crew competence and welfare standards
- Higher HFC DPI = Frequent crew-related deficiencies = Weakness in training, certification, or safety culture
This is a severity weighted Index accounting for detainable deficiencies with increased severity so that a single index is produced properly reflecting what happened.
The calculated value is expressed in milli-DPI (mDPI), equivalent to 1/1000 of a DPI. This representation is both more intuitive and visually meaningful, as it reflects deficiencies per 1000 PSCIs (1000 mDPI= DPI).
Why It’s Important
- This is a unique comparable KPI accounting for Human Factor and Crewing findings on same ports, ship types etc. and focus on a specific area giving an excellent health indication.
- Human Factors and Crew-related issues are leading causes of SMS underperformance, incidents, and repeat findings.
- PSC authorities treat crewing and human factors as high-risk areas (MLC, STCW, drills, safety culture).
- HFC DPI is a strong leading indicator of safety performance and operational resilience.
- Direct impact on reputation, crew welfare, and compliance credibility.
- Each of the three components of DPI (HFC DPI, ROC DPI, and SSE DPI) provide a clean benchmark against the market and a clear breakdown of compliance health.
Real Life Interpretation (So What?)
- HFC mDPI Performance < Average, i.e. Less than 50%: Indicates crewing-related weaknesses (training, certification, drills, living conditions) that may escalate to incidents, detentions; with additional review, training, auditing and HR focus and interventions required.
- Decreasing HFC mDPI over time: Evidence of stronger crew competence and better MLC/STCW compliance.
- HFC mDPI close to 0: Indicates excellent crew readiness, a key differentiator in PSC performance.
Methodology & Formula
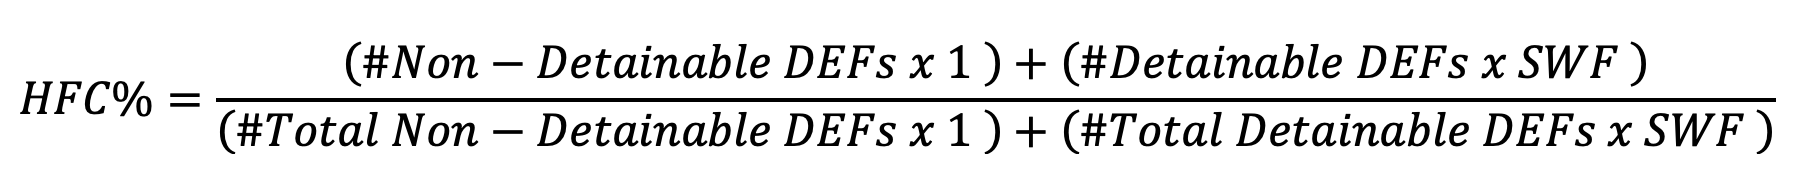
Where SWF = Severity Weighted Factor = 10, i.e. a detainable deficiency is 10 times more important than a non detainable one
HFC mDPI Box (below HFC mDPI text at the snapshot): HFC% with an important notice : HFC% + ROC% + SSE% = 100%
HFC mDPI Value = 1000 x HFC% x DPI
HFC mDPI Benchmark: Average HFC mDPI for the specific set of PSCIs accounting for PSCIs at the same Port, Ship Type and Average Values for the Last 36 Months as calculated on the PSCI History.
HFC mDPI Performance:
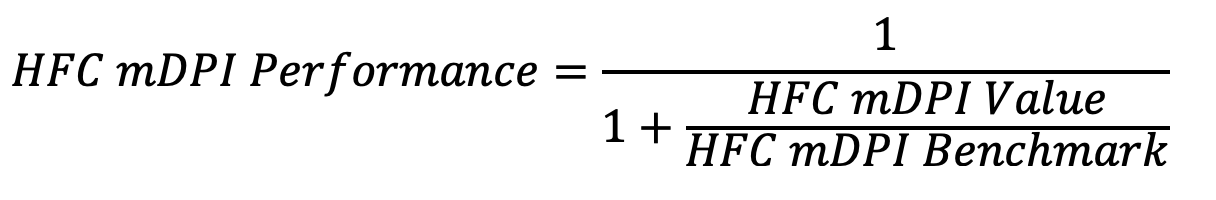
- 0% = Worst performance (far above benchmark)
- 50% = Average performance (value equal to benchmark)
- 100% = Best performance (HFC mDPI Value =0)
Worked Example
PSCIs = 55
Total Deficiencies: Non Detainable 85, Detainable 15 (100 total)
HFC DEF = Human Factor & Crewing Deficiencies = Non Detainable 15, Detainable 10
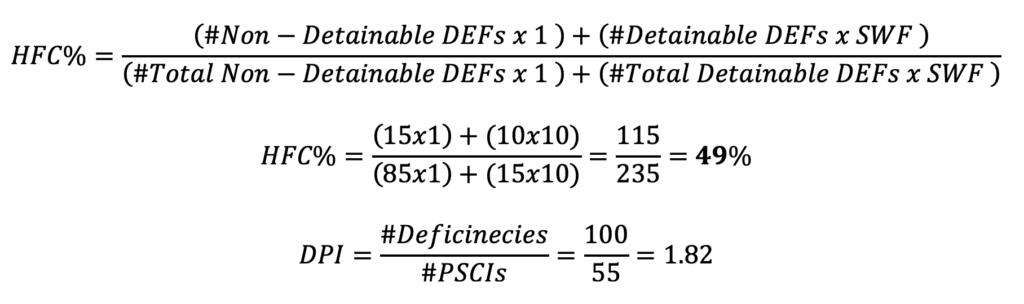
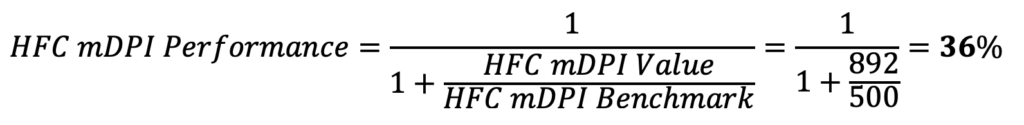
HFC mDPI Value = 49% x 1000x 1.82 = 892 mDPI
HFC mDPI Benchmark = 500 mDPI (same port, ship type, last 36 months)
Regulatory & Operational Compliance mDPI (ROC mDPI)
What We Measure & What it stands for
The average number of deficiencies per PSC inspection (PSCI) that are related to regulatory documentation, operational procedures, and statutory compliance (e.g., certificates, logbooks, MARPOL records, drills, voyage planning, ISM documentation).
ROC DPI reflects the vessel’s and company’s ability to maintain up-to-date certificates, accurate records, and compliant operational practices.
- Lower ROC DPI = Fewer regulatory/documentation/procedure deficiencies = Stronger compliance culture
- Higher ROC DPI = Frequent documentation/procedure deficiencies = Weaker regulatory oversight and operational discipline
This is a severity weighted Index accounting for detainable deficiencies with increased severity so that a single index is produced properly reflecting what happened.
The calculated value is expressed in milli-DPI (mDPI), equivalent to 1/1000 of a DPI. This representation is both more intuitive and visually meaningful, as it reflects deficiencies per 1000 PSCIs (1000 mDPI= DPI).
Why It’s Important
- Provides a unique comparable KPI focused on the administrative and operational execution of compliance.
- Documentation and procedural deficiencies are the common PSC findings, and they often trigger further more detailed inspection by PSCOs.
- High ROC DPI signals weaknesses in Record-keeping, SMS implementation and overall implementation of regulatory requirements.
- ROC DPI is strongly linked to HFC DPI (crew execution) and SSE DPI (technical execution), providing a complete picture of PSC risk.
- Each of the three components of DPI (HFC DPI, ROC DPI, and SSE DPI) provide a clean benchmark against the market and a clear breakdown of compliance health.
Real Life Interpretation (So What?)
- ROC DPI Performance < Average, i.e. Less than 50%: Signals recurring procedural/documentation gaps — corrective training, auditing, and stronger managerial oversight needed.
- Improving ROC DPI over time: Evidence of stronger regulatory discipline, more robust SMS, and reduced PSC exposure.
- ROC DPI close to 0: Indicates excellent compliance management, a strong advantage in PSCI performance and vetting.
Methodology & Formula
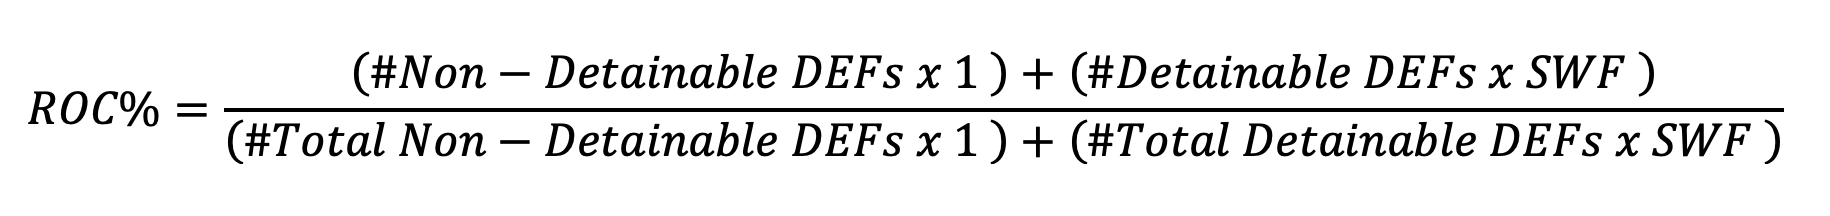
Where SWF = Severity Weighted Factor = 10, i.e. a detainable deficiency is 10 times more important than a non detainable one
ROC mDPI Box (below ROC mDPI text at the snapshot): ROC% with an important notice : HFC% + ROC% + SSE% = 100%
ROC mDPI Value (ROC mDPI) = 1000 x ROC% x DPI
ROC mDPI Benchmark: Average ROC DPI for the specific set of PSCIs accounting for PSCIs at the same Port, Ship Type and Average Values for the Last 36 Months as calculated on the PSCI History.
ROC mDPI Performance:
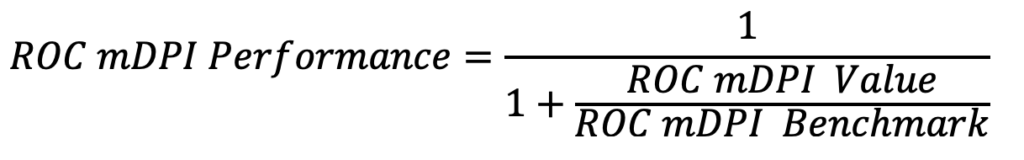
- 0% = Worst performance (far above benchmark)
- 50% = Average performance (value equal to benchmark)
- 100% = Best performance (ROC mDPI Value =0)
Worked Example
PSCIs = 55
Total Deficiencies: Non Detainable 85, Detainable 15 (100 total)
ROC Deficiencies: Non-Detainable = 30, Detainable = 0
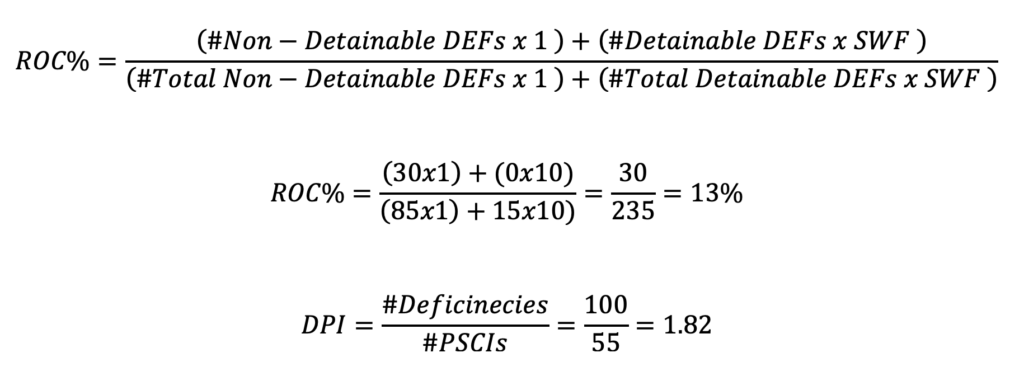
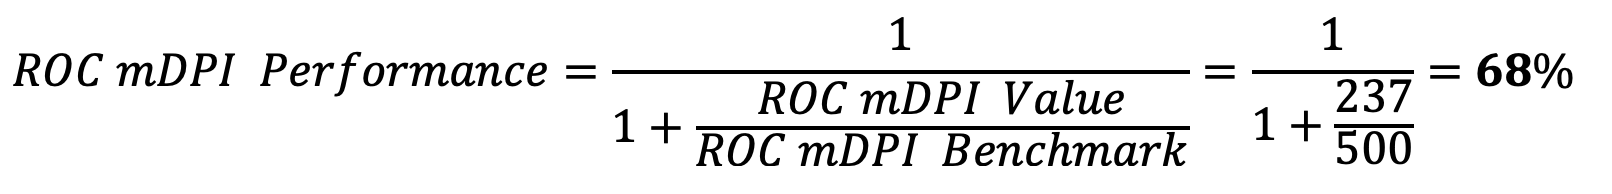
ROC mDPI Value = 1000 x 13%×1.82= 237 mDPI
ROC mDPI Benchmark = 500 mDPI (same port, ship type, last 36 months)
Ship Structure & Equipment mDPI (SSE mDPI)
What We Measure & What it stands for
The average number of deficiencies per PSC inspection (PSCI) that are related to a vessel’s structural condition, onboard equipment, and technical maintenance (e.g., hull integrity, watertight doors, firefighting systems, life-saving appliances, navigation equipment, machinery maintenance).
SSE DPI reflects the vessel’s physical condition, equipment readiness, and maintenance standards.
- Lower SSE DPI = Fewer structural/equipment deficiencies = Stronger maintenance culture
- Higher SSE DPI = Frequent technical/structural deficiencies = Poor maintenance discipline, higher safety risk
This is a severity weighted Index accounting for detainable deficiencies with increased severity so that a single index is produced properly reflecting what happened.
The calculated value is expressed in milli-DPI (mDPI), equivalent to 1/1000 of a DPI. This representation is both more intuitive and visually meaningful, as it reflects deficiencies per 1000 PSCIs (1000 mDPI= DPI).
Why It’s Important
- Provides a unique comparable KPI focused on the Ship Structure & Equipment and the maintenance culture.
- Structure and equipment findings are safety-critical and are common causes of detentions.
- High SSE DPI highlights weaknesses in maintenance systems, managerial oversight, and 3rd parties (class, Flag, vetting) follow-up.
- SSE DPI is strongly linked to detentions (DER), since technical/structural issues are often considered major PSC risks.
- Each of the three components of DPI (HFC DPI, ROC DPI, and SSE DPI) provide a clean benchmark against the market and a clear breakdown of compliance health.
Real Life Interpretation (So What?)
- SSE DPI Performance < Average, i.e. Less than 50%: Signals weaknesses in structural integrity and equipment maintenance, requiring enhanced managerial follow-up, drydock/maintenance planning, and technical audits.
- Improving SSE DPI over time: Evidence of stronger maintenance culture, proactive defect management, and reduced PSC exposure.
- SSE DPI close to 0: Indicates excellent physical condition and equipment readiness — a strong differentiator in inspections and vetting.
Methodology & Formula
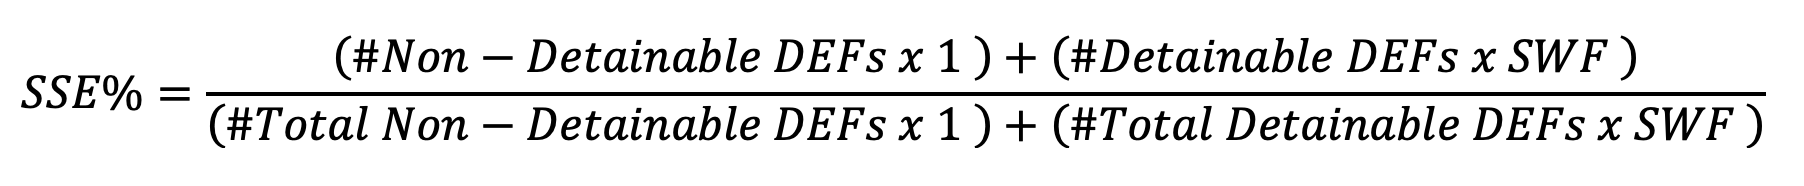
Where SWF = Severity Weighted Factor = 10, i.e. a detainable deficiency is 10 times more important than a non detainable one
SSE mDPI Box (below SSE mDPI text at the snapshot): SSE% with an important notice : HFC% + ROC% + SSE% = 100%
SSE mDPI Value = 1000 x SSE% x DPI
SSE mDPI Benchmark: Average SSE DPI for the specific set of PSCIs accounting for PSCIs at the same Port, Ship Type and Average Values for the Last 36 Months as calculated on the PSCI History.
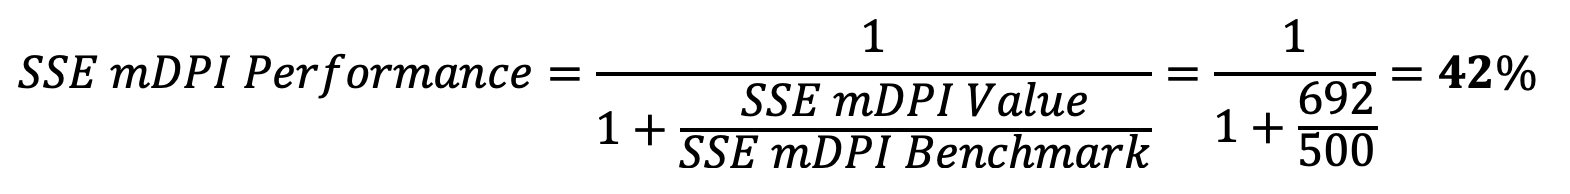
SSE mDPI Performance:
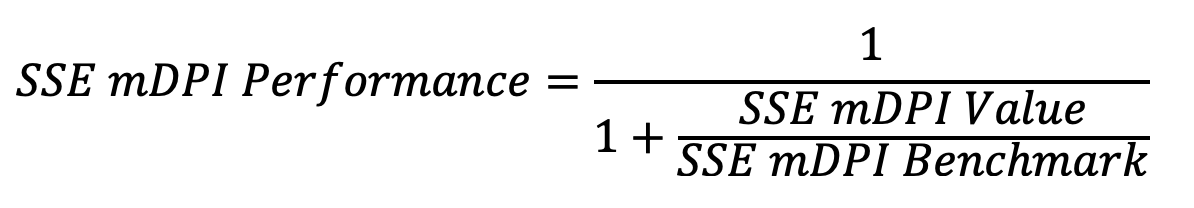
- 0% = Worst performance (far above benchmark)
- 50% = Average performance (value equal to benchmark)
- 100% = Best performance (SSE mDPI Value =0)
Worked Example
PSCIs = 55
Total Deficiencies: Non Detainable 85, Detainable 15 (100 total)
SSE Deficiencies: Non-Detainable = 40, Detainable = 5
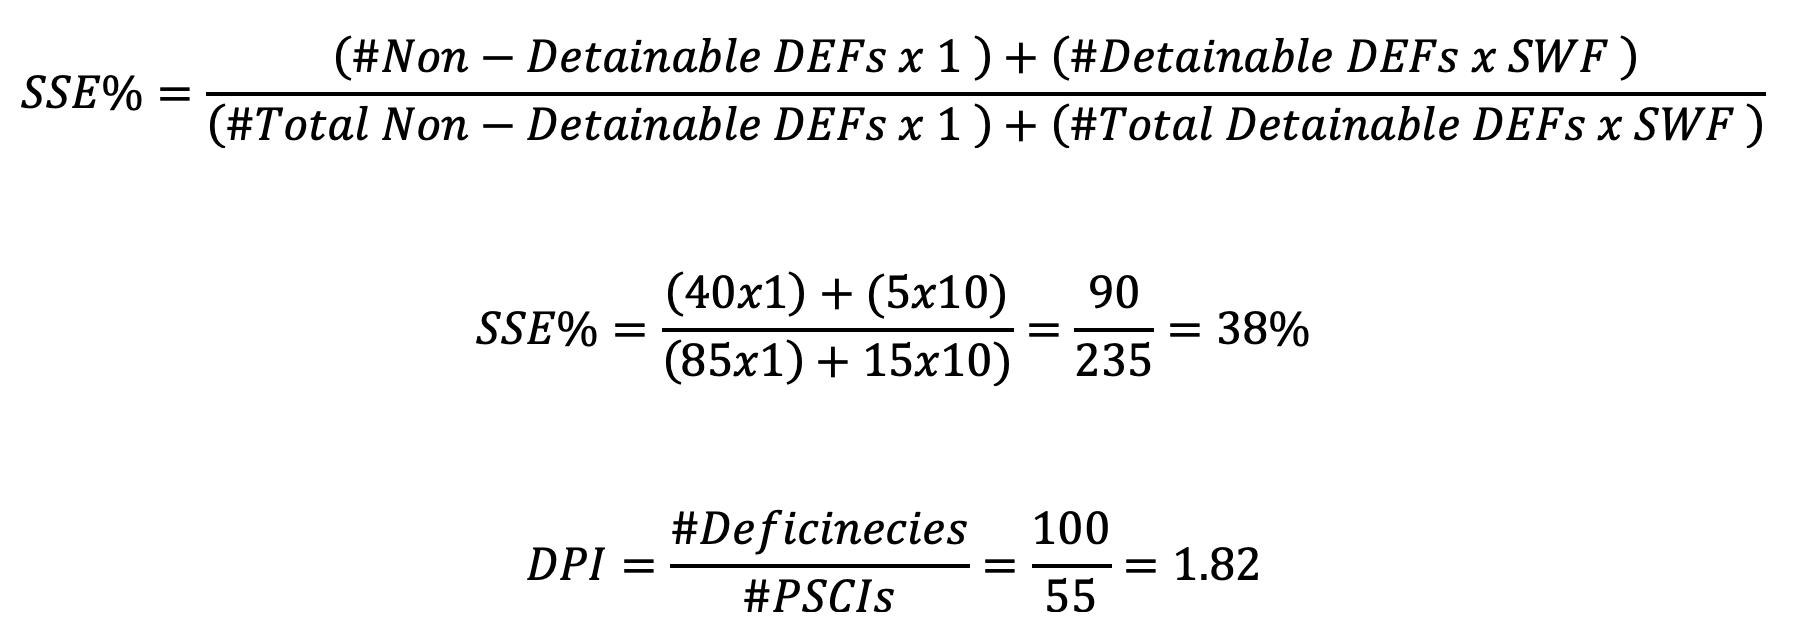
SSE mDPI Value = .38 x 1000 x 1.82 = 692 mDPI
SSE mDPI Benchmark = 500 mDPI
Calculating KPI Values, Benchmarks & Performance
The Values for each KPI are based on the performance of Each PSC Inspection, as calculated on the TRAIL report and then on a Ship, Manager, Port, Class, Flag etc. level on the basis of the PSCIs consisting PSCI History of the asset. Thet means that they are geo-tagged on the exact port that the PSCI has been conducted.
The Benchmark values are also the average values applicable on each PSCI for the Ship type on the same port and in that fashion they follow every PSCI and contribute on the calculation of the Benchmarks when necessary.
Given that the best value in all KPIs used are always the smallest one (beating the benchmark means that you have a lower value than the benchmark in this case) and in order to provide a meaning outcome is:
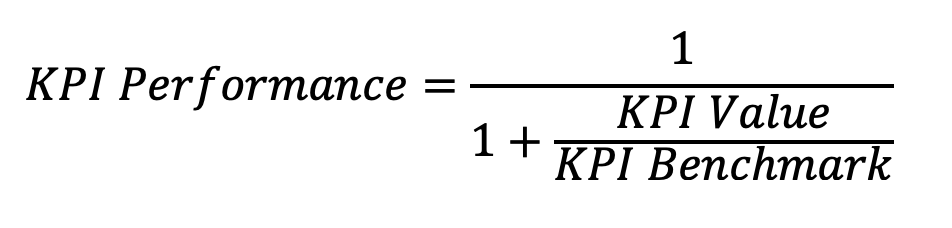
With the outcome always a % value from 0 (worst performance) to 50% (aveage0 through 100% (best) performance. Given the nature of the values and the performance they have real life Interpretation.
- KPI Performance < Average, i.e. Less than 50%: This is performance below average, with a clear indication of the gap between the performance and the average 50% where improvements should be considered.
- Improving KPI Performance over time: Evidence of improved performance in the specific area.
- KPI Value close to 0: Indicates performance excellence where always the 0 values are the best, synonym to 100% performance as the formula
Calculating SCORE
SCORE is calculated on each PSCI, Ship, Manager, Port, Class, Flag, etc. and it is the basis of benchmarking in the platform. SCOREs are available on all PSCIs and all Tabs, on the same basis.
The SCORE represents the overall PSC performance, expressed as a weighted composite of seven KPIs. Each KPI is first converted into a Performance Value (KPIp) on a 0–100% scale, where:
- 0% = Worst performance
- 50% = Average (benchmark level)
- 100% = Best performance
The calculation ensures that each KPI is assessed against its benchmark, reflecting how well or poorly it performs in relation to the peer benchmark at any given time.
The SCORE is then calculated as follows:
SCORE = 25% x DPIp + 25% x DERp + 10% x SDRp + 10%x PDIp + 10%x HFC mDPIp + 10%x ROC mDPIp + 10%x SSE mDPIp
The value of the SCORE is ranging from 0 to 100 where 0 indicates worst performance, 50 is the average and 100 is the best performance.
The performance is split into five (5) Classification Tiers indicated with letters:
A: Top 20% Tier (i.e. performances between 80-100%)
B: Top 40% Tier (i.e. performances between 60-80%)
C: Average Tier (i.e. performances between 40-60%)
D: Bottom 40% Tier (i.e. performances between 20-40%)
E: Bottom 20% Tier (i.e. performances between 0-20%)
PSC Benchmarking
Benchmarking Principles
The Entiry Benchmarking within the platform is perdformed on the basis of the following key principles:
Fleet Segments used in the platform
RISK4SEA monitors the performance of Ships splatted in segments as it makes more sense and at the same time not allowing ships of different segments to be compared with each other.
We split the global fleet into the following segments, based on DWT:
- Bulker – Handysize (<35k DWT)
- Bulker – Handymax (35-50k DWT)
- Bulker – Supramax (50-67k DWT)
- Bulker – Panamax (67-100k DWT)
- Bulker – Cape (>100k DWT)
- Bundle: All dry bulk (Segments 1, 2, 3, 4, 5)
- General Cargo
- Tanker – Small Product (<25k DWT)
- Tanker – MR1/MR2 (25 – 60k DWT)
- Tanker – LR1/LR2 (60-125k DWT)
- Tanker – Suezmax (125-200k DWT)
- Tanker – VLCC (>200k DWT)
- Bundle: All tankers (Segments 8, 9, 10, 11, 12)
- LNG/Gas Carriers
- LPG Carriers
- Container – Feeders (<10k DWT)
- Container – Large (10-90k DWT)
- Container – Ultra Large (>90k DWT)
- Bundle: All containers (Segments 16, 17, 18)
- Vehicle Carrier
- Ro Pax
- Offshore
- Other Ship Type
- Bundle: All ships (All above segments)
Data Perods used for Benchmarking
All Benchmarking Intervals are set for a period of 36 Full Calendar Months of PSCI Data and in every occasion the actual dates are available to the user either in the platform or in the report.
PSC Data Used for Benchmarking
RISK4SEA uses validated PSC inspection intelligence as the raw input for benchmarking, including inspections and detentions together with the accompanying inspection details. Each inspection is assigned to the relevant Port, Manager, Class and Flag as applicable at the time of the inspection, ensuring results reflect the actual operational reality of the period under review.
PSCIs credited to Managers
Benchmarking is performed on the basis of the Manager attribution rule: a PSC inspection is credited to the Ship Manager provided they were the active managers and DOC holders on the actual date of inspection, regardless of whether the ship was under their management for a short period (days/weeks) or long-term.
Benchmarking Data exclusion list
Benchmarking is performed on taking into consideration an exclusion list: while PSCIs may exist in the broader platform dataset, PSCIs carried out in certain jurisdictions are not included within the benchmarking calculations, as these cannot be consistently validated across all market players. The current exclusion list includes (in alphabetical order): Angola, Bahrain, Brunei, Costa Rica, French Polynesia, Iraq, Kuwait, Nicaragua, North Korea, Pakistan, Qatar, Russian ports banned by Paris MoU, Saudi Arabia, Somalia, Taiwan, UAE.
Top Performing Ships, Managers, Class, Flag
PSC Benchmarking Methodology (How Rankings Are Built)
Top performing Ships, Managers, Ports, Flags and Class are identified through a structured benchmarking methodology designed to ensure fairness, consistency and real comparability across the global PSC ecosystem.
Objectives: Fair “Apples-to-Apples” Benchmarking
To benchmark PSC performance properly, comparisons must be made only between true peers. In shipping, this means each entity is benchmarked against entities on the basis of performance on same/similar operational profile, namely: same Ship Type, same Fleet Segment (DWT-wise), similar Year of Built (YoB) / age group, and most importantly, performance on the same Port against the same peer population.
These principles are applied consistently throughout the RISK4SEA platform to ensure every entity is treated fairly and evaluated within an equivalent operating environment.
Fleet Segmentation: Making Benchmarking Possible
Benchmarking cannot be meaningful unless the global fleet is split into segments with comparable exposure and risk profiles. RISK4SEA applies predefined fleet segments by Ship Type and size class, enabling fair comparisons across bulkers, tankers, containers, gas carriers and additional ship categories.
Benchmarking Time Window
All Top Performer results are based on a fixed rolling window of the last 36 calendar months, as stated on each published ranking and report. This period is long enough to smooth out short-term volatility, while still reflecting current operational performance.
KPIs Used in the Benchmarking Model
Performance is calculated using a KPI framework that captures both deficiency exposure and detention risk, while also providing deeper visibility into the nature of non-conformities. The KPIs below are used to calculate performance.
- Deficiency per Inspection (DPI) is the average number of deficiencies per inspection. Lower DPI indicates stronger PSC performance.
- Detention Rate (DER) is the percentage of detentions per 100 inspections. Lower DER indicates stronger PSC performance.
- SMS Deficiency Rate (SDR) is the percentage of deficiencies related to Safety Management System performance, including repeat deficiencies and ISM Code-related findings. Lower SDR indicates stronger PSC performance.
- Predicted Deficiency Index (PDI) is the percentage of deficiencies recorded during a PSC inspection that were predictable based on the port’s deficiency profile and enforcement patterns. Lower PDI indicates stronger preparedness and better control of recurrent risk items.
- Human Factors & Crewing mDPI (HFC mDPI) reflects human factor and crewing-related deficiencies per 1,000 inspections (milli-DPI), including competence, drills, working/rest hours, MLC-related items and certification issues.
- Regulatory & Operational Compliance mDPI (ROC mDPI) reflects deficiencies per 1,000 inspections linked to documentation, procedures, statutory compliance and operational records.
- Ship Structure & Equipment mDPI (SSE mDPI) reflects deficiencies per 1,000 inspections linked to structure, equipment condition and technical readiness such as LSA/FFA systems, watertight integrity, navigation equipment and maintenance-related items.
On all KPIs a Lower Value indicates better performance.
TRAIL & Snapshots on every entity: Linking KPR values, Benchmarks and SCOREs
Each PSCI results are supported by TRAIL (Track, Review, Assessment & Inspection Learning), which provides the inspection-level record behind the performance outcome. TRAIL includes KPI values, peer benchmarks, inspection scoring, deficiency classification, insights on similar findings across the fleet, peer performance on the same port, and lessons learned for continuous improvement.
Further details on TRAIL are available at the dedicated TRAIL section of the platform.
The same principle applies to every entity with their respective snapshots.
Performance Calculation and Performance Tiers
Each entity’s KPI values are calculated and compared against the relevant benchmark dataset formed from peer ships under the same segment, age group and port exposure rules. KPI results are then converted into performance values on a normalized 0–100% scale, where
- 0% represents worst performance,
- 50% represents benchmark (average) performance, and
- 100% represents best performance.
The overall SCORE represents total PSC performance expressed as a weighted composite of KPI performance values, delivering one clear benchmarking output across all entities.
To make results easy to interpret, performance is split into five classification tiers.
Tier A represents the Top 20% performers (80–100%).
Tier B represents the Top 40% performers (60–80%).
Tier C represents Average performance (40–60%).
Tier D represents the Bottom 40% performers (20–40%).
Tier E represents the Bottom 20% performers (0–20%).
Clarifications on Benchmarking Pools
Each entity is benchmarked with the same range of samples, that means within the same range of PSCIs, called PSCI Pools that are assigned as follows:
Research has indicated that normally when we plot a set of values of the same entity class (Ship, Manager, port, etc.) the median number of PSCIs per entity (i.e. the Number of PSCIs corresponding to approximately the half of the entity population) should be the limit to exclude those who do NOT meet this criterion. Normally this pool of PSCIs is in the range of 10-20% of the total Segment PSCIs for the period under review.
Then normally the remaining pool of the entity class is split in either two (2) or three (3) pools for better classification purposes and listed in each analysis of the Top Performers along with the benchmarking dataset breakdown indicating:
- The PSCI Range of each pool, including the limit of PSCIs to be included in the Benchmark
- The Entity population per pool along with their corresponding PSCIs and PSCI% of the overall group
Clarifications on missing PSCIs
The case of a missing PSCIs may be a case (especially zero deficiency PSCIs from west Africa ports not officially reported to the port or the national Authority or International to any MoU or other party which it does NOT affect the actual results presented here in this report for the following reasons:
- These Reports (if any) have NOT been reported to anywhere else than the ship and therefore cannot be verified or inserted into the platform unless provided by the Manager of the ship.
- We have reasons to believe that the phenomenon may be more or less of the same limited extend and that may be applicable to other managers as well.
- Given the methodology, the addition of a PSCI (with the exception of a Detention) will NOT alter the benchmarking performance of a full fleet that has to do with the sum of PSCIs from many ships.
- The basis of the benchmarking is to have and apply a set of rules and criteria to be used equally across the full spectrum of the data under review and this is what we have done in this report.
Most Challenging Ports
The same principles apply for the benchmarking of ports, similar to the benchmarking of all other entities (Ships. Managers, Class, Flag) with one important difference here
- While for Ships, Managers, Class and Flags the Best performer between peers is always the one with the best performance (i.e. SCORE highest to 100%)
- For the Most Challenging Ports we are looking at exactly the opposite (as we use an inverse wording/approach) : The most challenging port is the one with the lowest SCORE (i.e. SCORE close to 0%)
All KPI Benchmarks for ports are the Global Averages for the corresponding segment
All KPI & SCORE Calculations are applied using the same formulas as indicated in the methodology section
Deficiency Benchmarking
We monitor each PSCI and we have accurate deficiency Profiles for every Port, PSC Station and Segment or bundle worldwide at any given time.
We analyze deficiencies in 4 Class
- As per Deficiency Code (a 5 digit code, similar to what each PSC Authority is reporting)
- As per Deficiency Categories, similar to what the key MoU are using
- As per Deficiency Groups, this is a RISK4SEA methodology
- As per Deficiency Domains, this is a RISK4SEA methodology
We report on the following Deficiency Categories on each Port State Control Inspection:
- Alarms
- Cargo operations including equipment
- Certificate & Documentation
- Dangerous Goods
- Emergency Systems
- Fire safety
- ISM Code
- ISPS Code
- Life saving Appliances
- MLC
- Pollution Prevention
- Propulsion and auxiliary machinery
- Radio Communications
- Safety of navigation
- Structural Conditions
- Water/Weathertight Conditions
- Other
We report on the following Deficiency Groups on each Port State Control Inspection:
- Air Emissions
- Alarms
- Anti fouling
- Ballast Water
- Bridge Equipment
- Bridge Procedure
- Cargo
- Communications
- Competence
- Crew Certificates
- Crew Procedures
- Dangerous Goods
- Deck Procedures
- Drills
- Engine Maintenance
- Engine Procedures
- Environmental Procedures
- Fatigue
- Fire Construction
- Fire Equipment
- Fire Maintenance
- Fire Procedures
- Food & Catering
- Garbage
- ISM
- ISPS
- Lifeboats
- Liferafts
- Living Conditions
- Load Lines
- LSA Equipment
- LSA Maintenance
- Maintenance – Hull
- Maintenance – Structure
- Maintenance – Systems
- MARPOL Annex III
- NLS Cargo
- Oil Pollution – Maintenance
- Oil Pollution – Procedure
- Other
- Safety Culture
- Safety Procedures
- Sewage
- Ship Certificates
- Shipboard Plans
- Wages
- Working Conditions
We report on the following Deficiency Domains on each Port State Control Inspection
- Human Factors & Crewing (HFC), covering issues related to a vessel’s structural condition, onboard equipment, and technical maintenance (e.g., hull integrity, watertight doors, firefighting systems, life-saving appliances, navigation equipment, machinery maintenance).
- Regulatory & Operational Compliance (ROC), covering issues related to regulatory documentation, operational procedures, and statutory compliance (e.g., certificates, logbooks, MARPOL records, drills, voyage planning, ISM documentation).
- Ship Structure & Equipment (SSE), covering issues related to human factors and crewing issues (e.g., certificates, competence, drills, working/rest hours, living conditions, MLC compliance).
The above domains have their own DPIs that are reported and calculated in details on every PSCI and credited to all assets of the platform (Ships, managers, ports, etc.)
Deficiency Benchmarking Methodology
The Deficiency Benchmarking methodology is the same with the one used on the HFC, ROC & SSE KPI Benchmarking.
For every Deficiency Class (category, group or Domain), similarly to HFC, ROC & SSE KPIs, we need:
- DC SW% : Deficiency Class Severity Weighted %
- DC Value : Deficiency Class Value
- DC Benchmark : Deficiency Class Benchmark
- DC Performance or SCORE
Real Life Interpretation (So What?)
-
DC Performance < Average, i.e. Less than 50%: Signals weaknesses in the Deficiency Class areas.
-
Improving DC Value over time: Evidence of better accrual performance, and reduced PSC exposure.
-
DC Value close to 0: Indicates excellent performance and readiness — a strong differentiator in inspections and vetting.
Methodology & Formula
DCSW% = (# of Non Detainable DC Deficiencies x 1 + # of Detainable DC Deficiencies x SWF) / (# of Total Non Detainable Deficiencies x 1 + # of Total Detainable Deficiencies x SWF)
Where SWF = Severity Weighted Factor = 10, i.e. a detainable deficiency is 10 times more important than a non detainable one
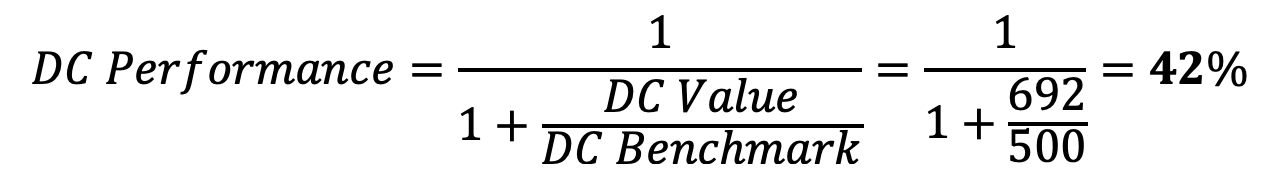
DC Value = 1000 x DC(SW%) x DPI
DC Benchmark: Average DC DPI for the specific set of PSCIs accounting for PSCIs at the same Port, Ship Type and Average Values for the Last 36 Months as calculated on the PSCI History.
DC Performance:
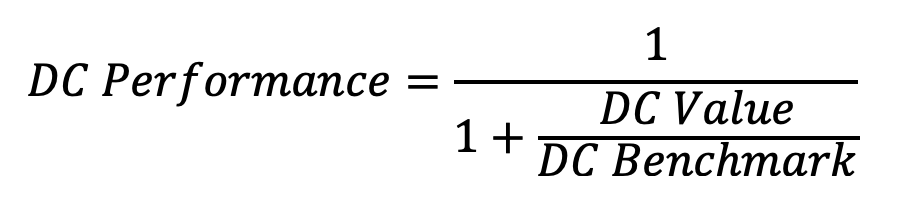
- 0% = Worst performance (far above benchmark)
- 50% = Average performance (value equal to benchmark)
- 100% = Best performance (DC Value =0)
Worked Example
PSCIs = 55
Total Deficiencies: Non Detainable 85, Detainable 15 (100 total)
SSE Deficiencies: Non-Detainable = 40, Detainable = 5
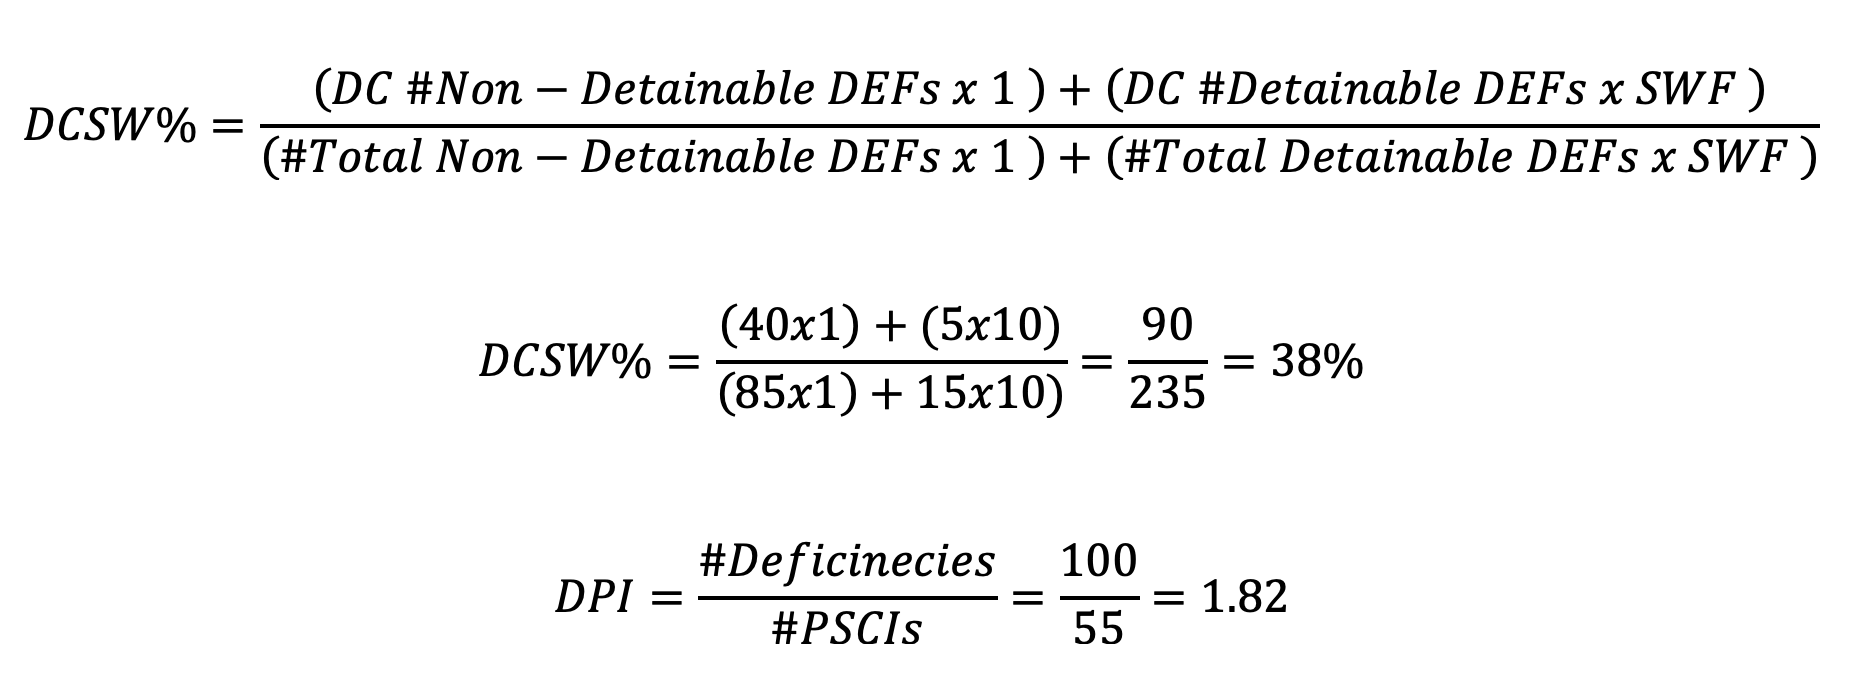
DC Value = .38 x 1000 x 1.82 = 692 mDPI
DC Benchmark = 500 mDPI
PSC Automation
PSC Automation Architecture
PSC Automation works bringing many parts of the system together as outline below:
Please refer to https://risk4sea.com/automation/
Port Call Risk Assessment (POCRA)
Please refer to https://risk4sea.com/POCRA
E-mail Alert System
On the outcome of the Automated POCRA the system will proceed with decision making for every POCRA Risk Level (PRL) as incorporated into the system.
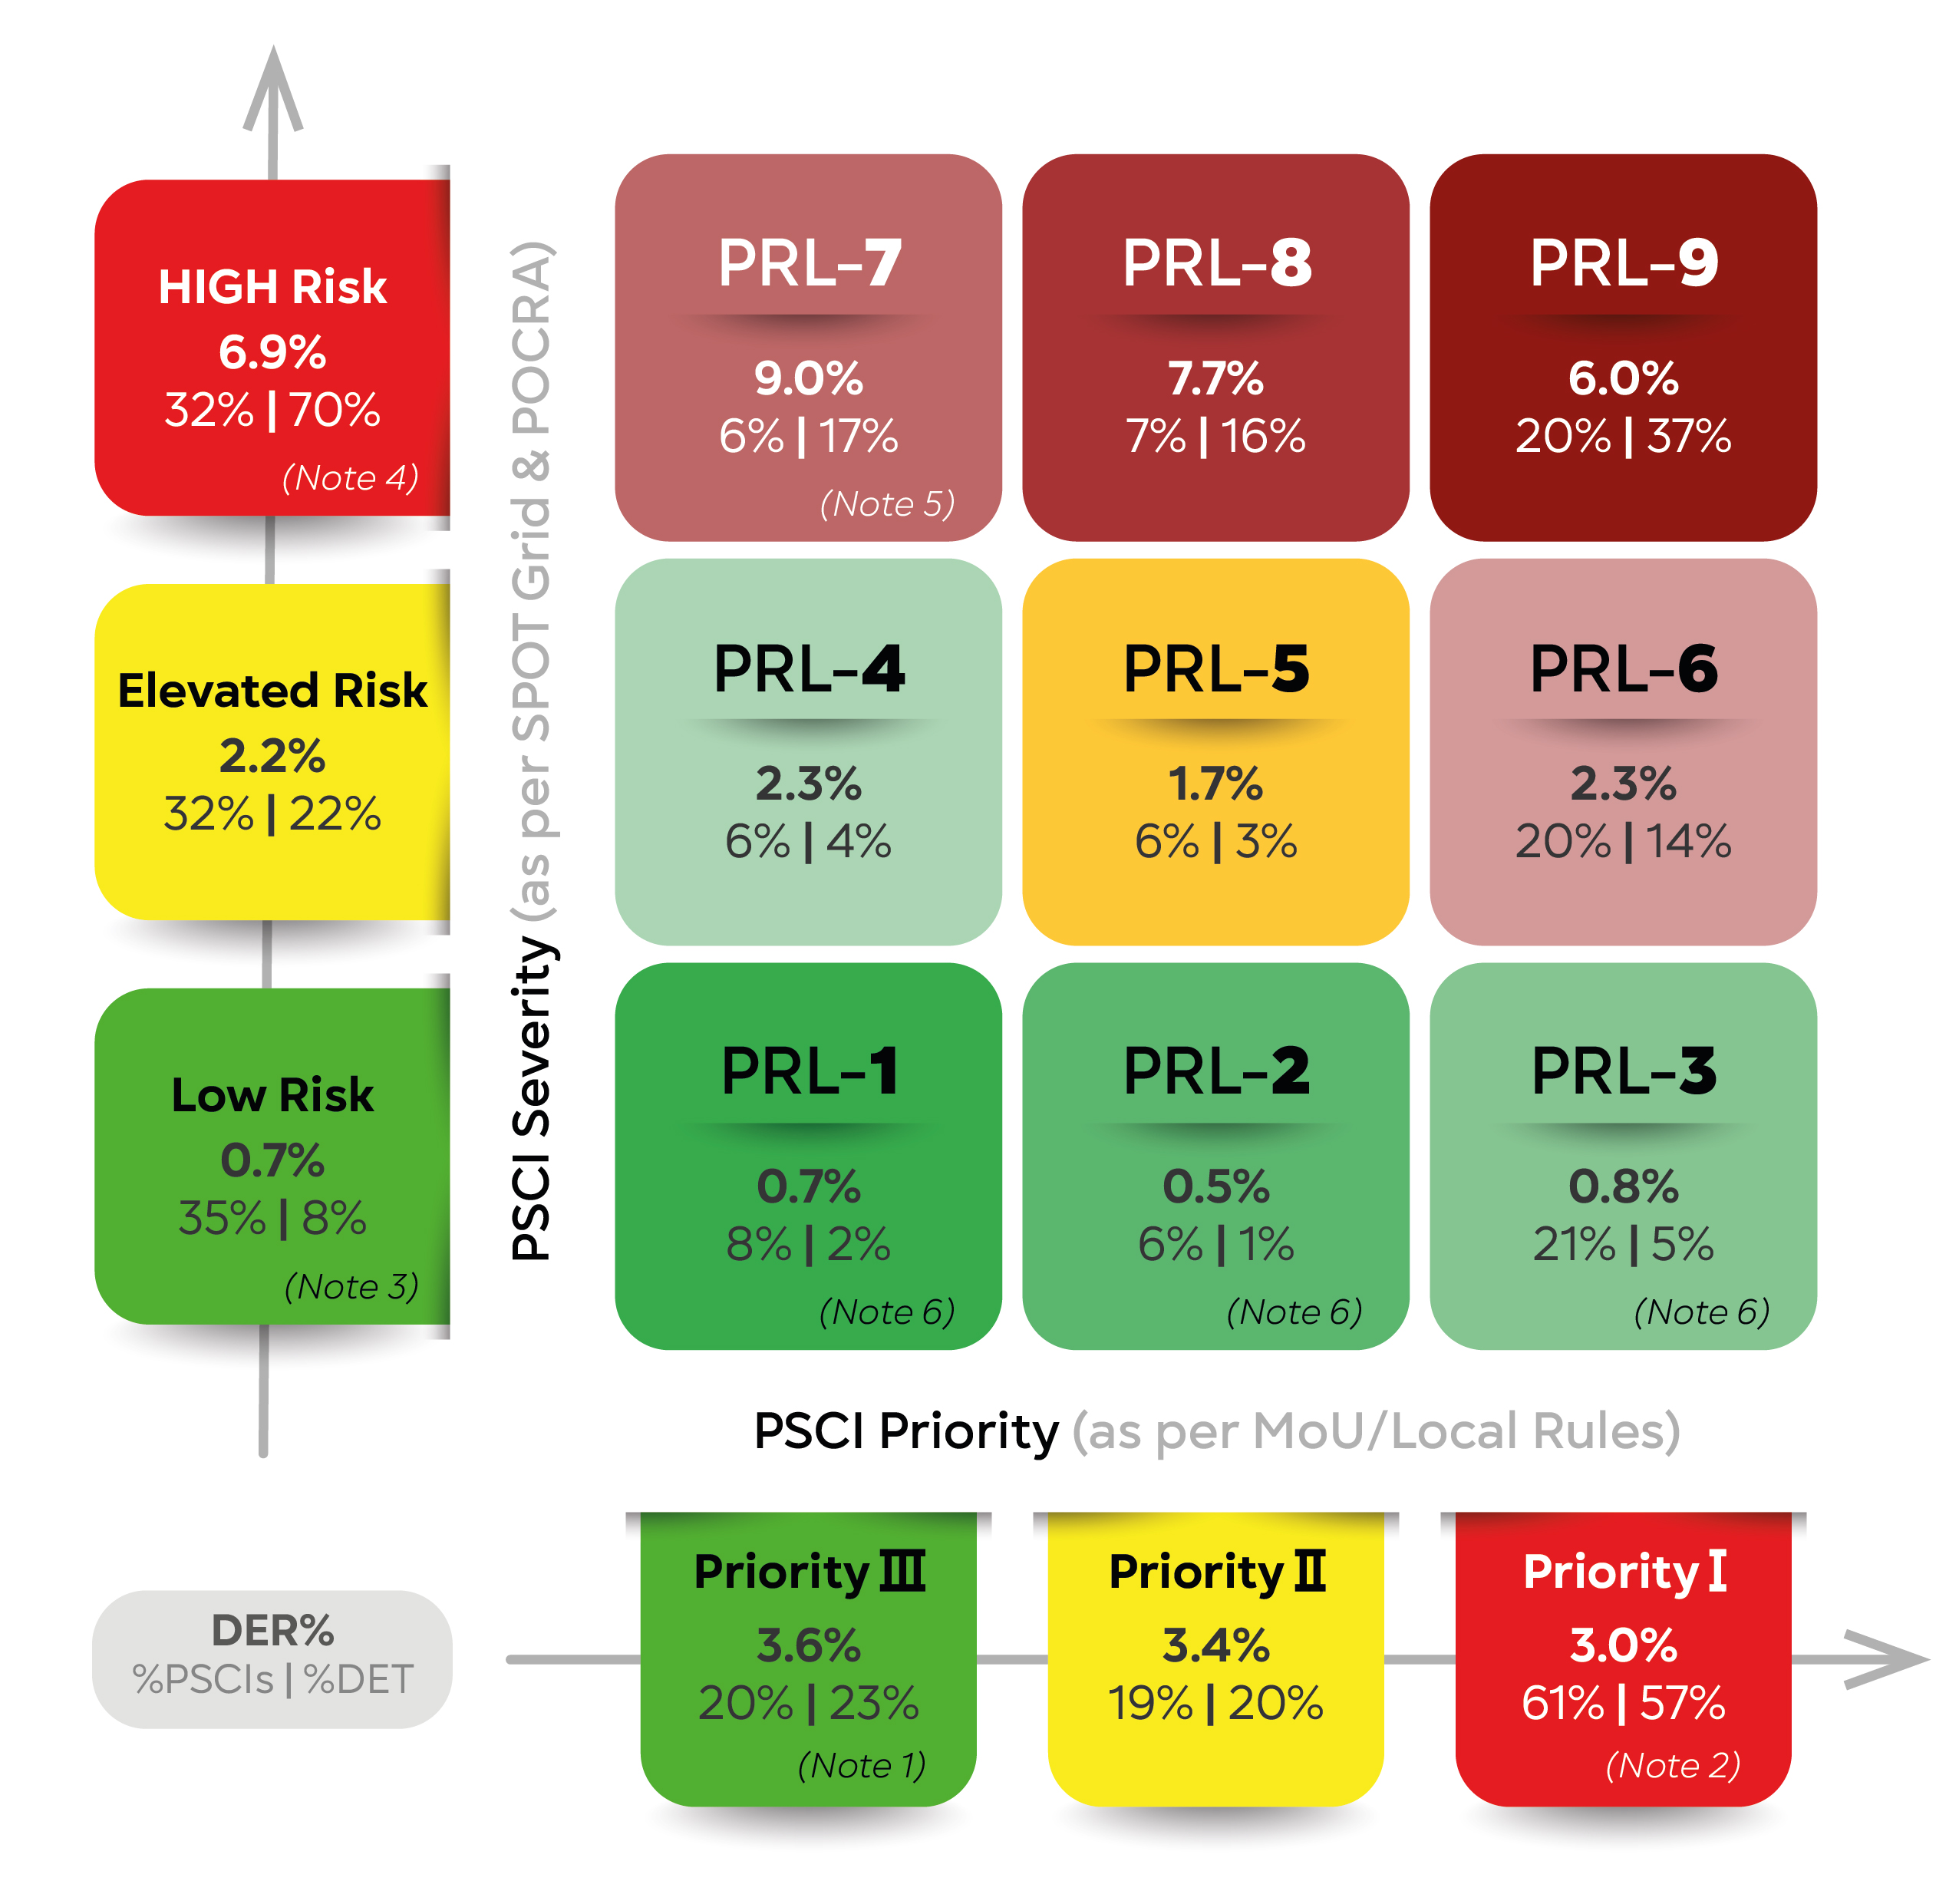
For every POCRA Risk Level (PRL) the system will make a decision taking the following into consideration, as agreed in advance with the manager of the ship:
- Ship PSCI Priority
- Additional Review of the case of PRL-7 as necessary basis on the Eligible Ship Inspection Share (ESIS)
- Manager with to include/exclude ports, countries, MoU etc.
- Application of automated settings agreed on the checklist length, type and delivery format
- Additional Settings agreed in advance
The decision will include the following topics:
- To send or not to send an e-mail
- The exact wording of the mail
- The attachments to the mail
- The format of the checklist
- The update of the necessary Future Calls Dashboard
Smart PSC Automated Risk Checklist (SPARC)
Please refer to https://risk4sea.com/SPARC
Track, Review, Assessment & Inspection Learning (TRAIL)
Please refer to https://risk4sea.com/TRAIL
Monitoring Tools
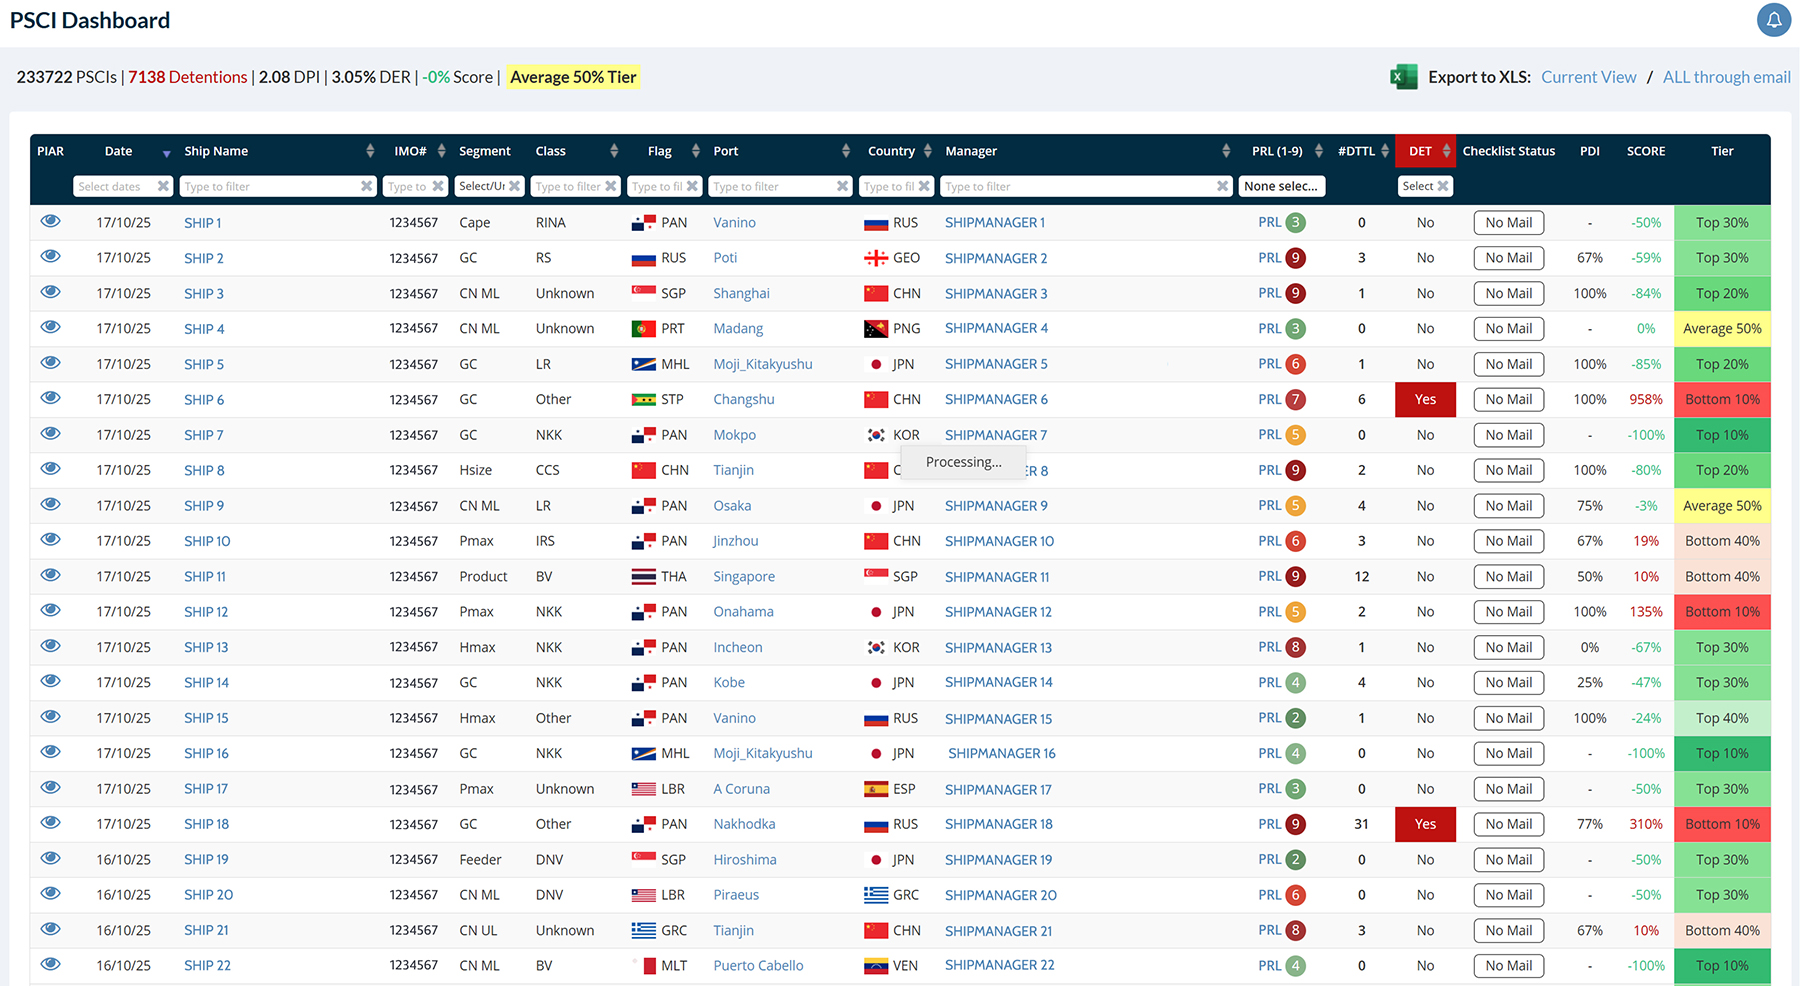
PSCI Dashboard
The PSCI Dashboard is one of the main platform tools to monitor the performance of the fleet under management and it is updated daily with the PSCIs and the intelligence behind each PSCI (Track, Review, Assessment & Inspection Learning, (TRAIL)) allowing the users to have a 1-click view of all the important issues surrounding the fleet performance.
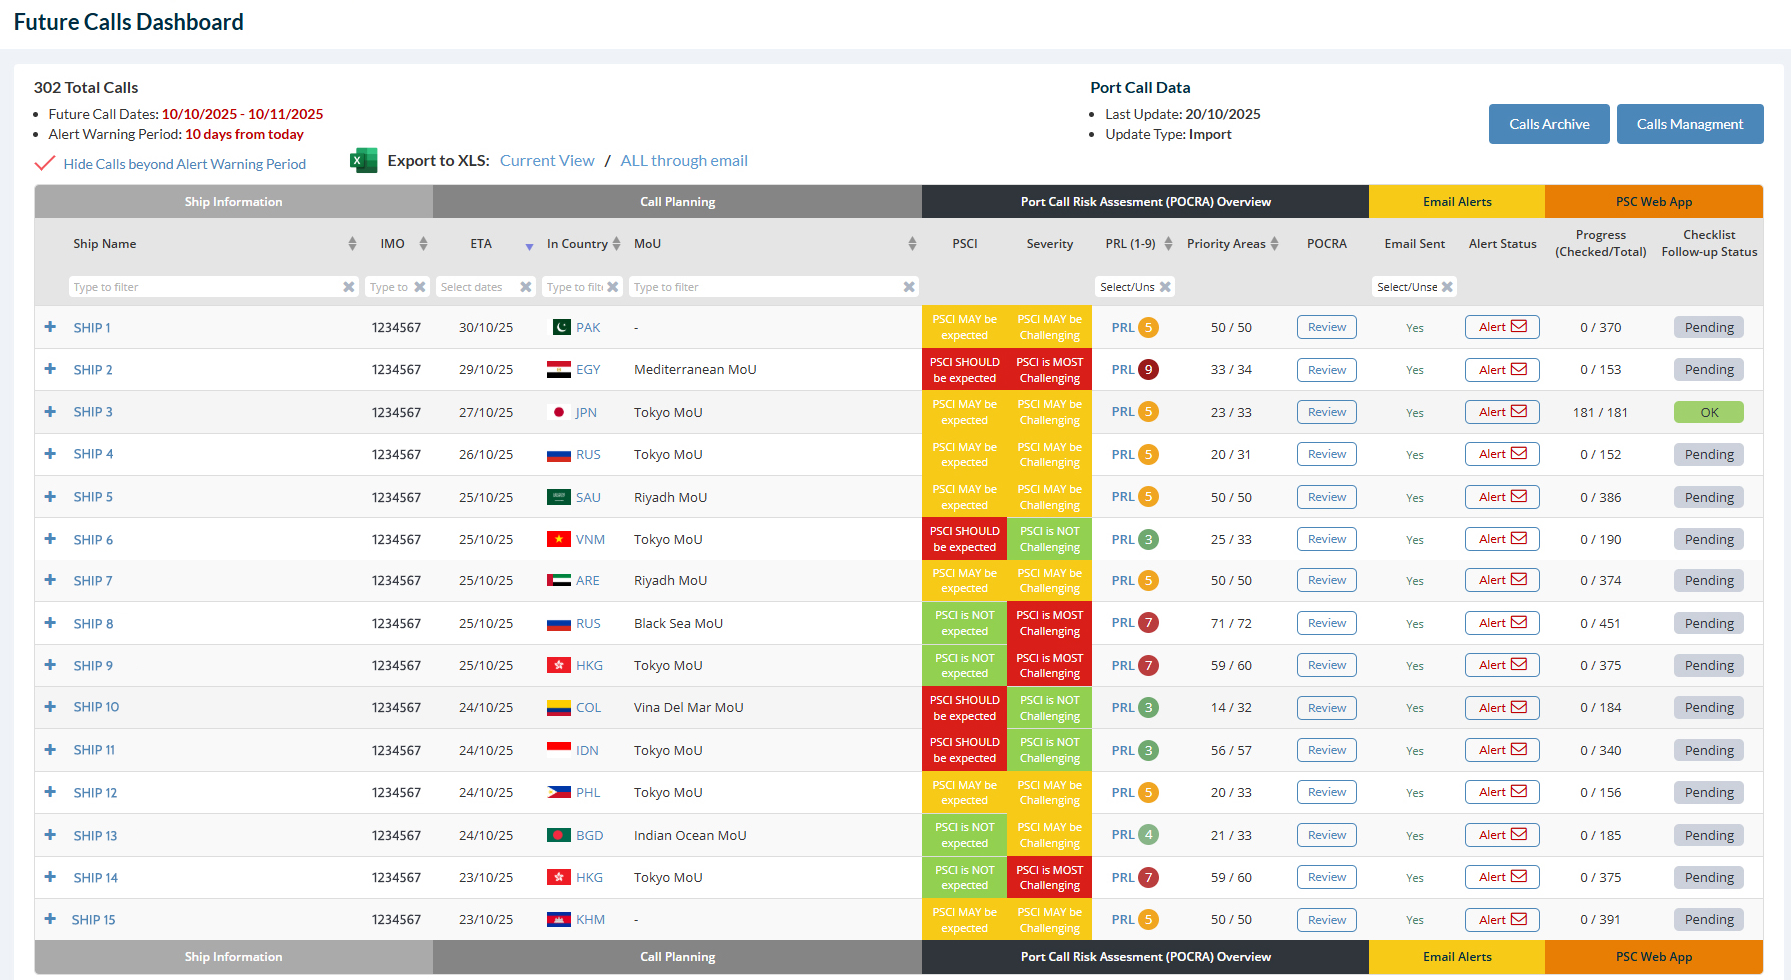
Future Calls Dashboard
The Future Calls Dashboard is one of the main platform tools to monitor the performance of the fleet under management and it is updated daily with the calls uploaded to the system daily allowing the users to have a 1-click view of all the important issues surrounding fleet performance.
Port Alerts Dashboard
The Port Alerts Dashboard is summarizing the key alerts for all ports and fleet segments across the globe on a daily basis and provides an excellent early notification warning tool for all users with the intelligence made available in the Port Call Risk Assessment (POCRA). Specifically it reports/coverts;
- # of PSCIs in a given port for the segment
- Detentions Rate (DER) Last 36 Calendar Months
- Detentions Rate (DER) Last 12 Calendar Months
- Detentions Rate (DER) Last 10 PSCIs
- Detentions Rate (DER) Last 5 PSCIs
- #Repeat Detainable DEF Areas, Last 10 Detentions
- #Repeat Detainable DEF Areas, Last 5 Detentions
- #Detainable Deficiency Areas (Unique)
- #Predictable Deficiency Areas (Unique)
POCRA Risk Level (PRL) Matrix
Please refer to https://risk4sea.com/PRL
Ship-Port Tier (SPOT) Matrix
Please refer to https://risk4sea.com/SPOT

PSC Intelligence
Powered by PSC Inspections
We host the largest and most comprehensive PSC intelligence database, going beyond just PSCIs and deficiencies. Our platform offers deep insights into actual inspections, from calculating PSCI windows for every port call to generating tailored checklists for specific ports, ships, and managers—ensuring everything is prepared efficiently and effectively.

PSC KPIs
Explore DPI, DER & KPIs vs Ship Age on specific Ports
Challenging Ports
Take a deep dive into the most challenging ports
POCRA
Get POCRA for your Ship @ next port of Call with Real Data
Best Performers
Find the top performers on each fleet segment
PSC WiKi
Explore & learn from the latest PSC Procedures