Ship-Port Tier (SPOT) Analysis
SPOT Analysis Explained (Ship–Port Tier Matrix)
Understanding PSC risk with simple Ship-Port combinations
What Is SPOT Analysis?
SPOT (Ship–Port Tier) Analysis shows how a ship’s performance interacts with a port’s difficulty level before a PSC inspection (PSCI).
- Ports may have many inspections, so one inspection does not change their tier from one day to another.
- Ships, however, have far fewer inspections (6–8 over 3 years), so one substandard inspection may heavily affect their performance tier..
This matrix is a representation of actual PSCI data based on over 230,000 inspections in the last 36 months, classifying every PSCI into one of 25 SPOT zones (Ship Tier from A to E vs Port Tier from A to E).
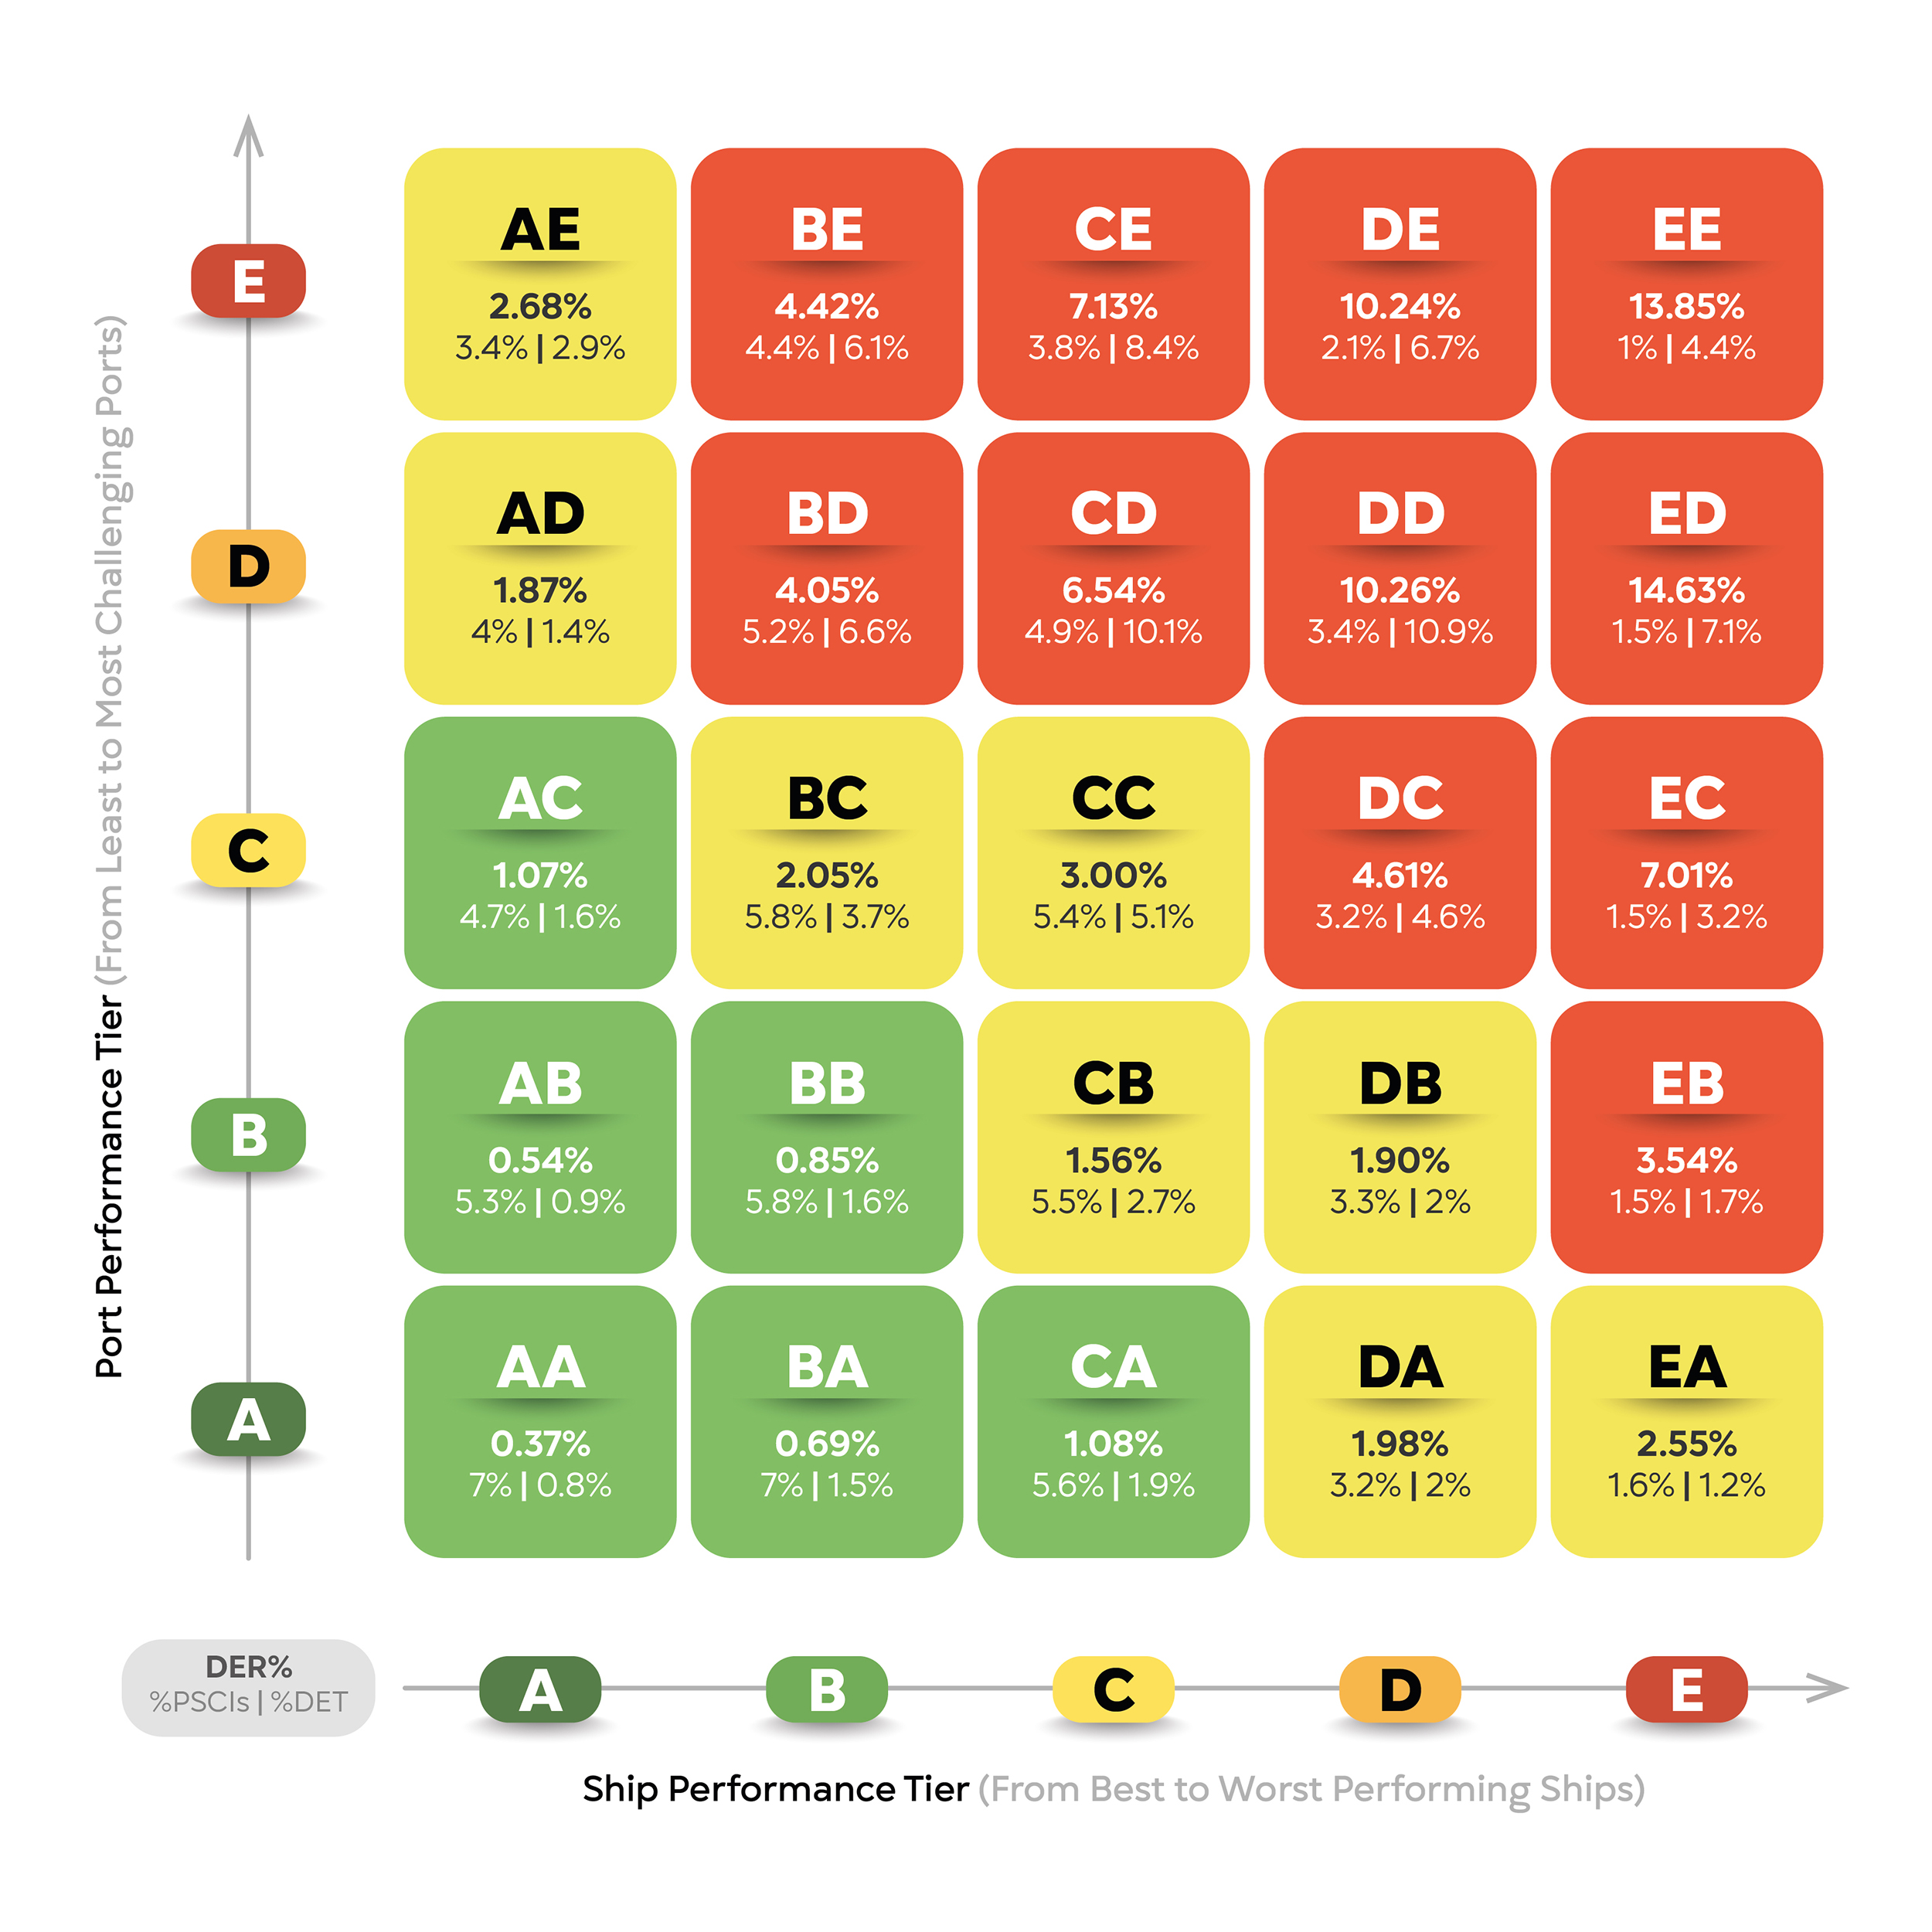
How to Read a SPOT Zone (Box)
Each box represents a specific situation:
| Ship Tier | Port Tier | Result = SPOT Box |
| A (Best) | C (Average) | AC |
Each box shows:
- % of total PSC inspections
- % of total detentions
- Detention Rate (DER) = Detentions ÷ Inspections
The analysis and breakdown of the colored zones included in the matrix is a as follows:
| SPOT Area | #Boxes | DER Range | #PSCIs | %PSCIs | #DET | %DET | DER |
| Red – High Risk | 11 | ≤1.1% | 73,553 | 32.5% | 5,041 | 69.8% | 6.85% |
| Yellow – Elevated Risk | 8 | 1.1% to 3.2% | 72,917 | 32.2% | 1,582 | 21.9% | 2.17% |
| Green – Low Risk | 6 | ≥3.2% | 80,130 | 35.4% | 595 | 8.2% | 0.74% |
| Total | 25 | 226,600 | 100.0% | 7,218 | 100.0% | 3.19% |
The following key notes and takeaways should be noted out of this research:
- The Red Boxes (11 boxes) represent a High Risk Zone, representing the 32% PSCIs and 70% of Detentions with an Average Detention Rate (DER) of 6.85%
- All Non Red Zones (14 boxes) have either Detention Rate close to or significantly lower of the 3.19% which is the global average
- In total the Elevated & Low Risk Zones (14 boxes) representing the 78% PSCIs and 30% of Detentions with an Average Detention Rate (DER) of 1.42%
- The Green Boxes (6 Boxes) represent a Low Risk Zone, representing the 36% PSCIs and 8% of Detentions with an Average Detention Rate (DER) of 0.74%
Key Findings from 230,000+ PSC Inspections
Major Insight: 32% of All PSC Inspections are responsible for the 70% of all Detentions. A powerful tool for targeted risk management.
Important Lessons
- Complacency may be lethal – even good ships get detained if they relax.
- Port Risk Matters – Port severity can be more influential than ship performance.
- Detentions can happen anywhere – even “safe” ports and top-tier ships can face detentions.
Why SPOT Works
SPOT helps identify dangerous combinations of ship vulnerability and port risk before the inspection happens.
It highlights where to focus attention, training, and resources.
Dive Deeper

PSC Intelligence
Powered by PSC Inspections
We host the largest and most comprehensive PSC intelligence database, going beyond just PSCIs and deficiencies. Our platform offers deep insights into actual inspections, from calculating PSCI windows for every port call to generating tailored checklists for specific ports, ships, and managers—ensuring everything is prepared efficiently and effectively.

PSC KPIs
Explore DPI, DER & KPIs vs Ship Age on specific Ports
Challenging Ports
Take a deep dive into the most challenging ports
POCRA
Get POCRA for your Ship @ next port of Call with Real Data
Best Performers
Find the top performers on each fleet segment
PSC WiKi
Explore & learn from the latest PSC Procedures