Australia PSC Scorecard L36M (Sep. 2022 – Aug. 2025)
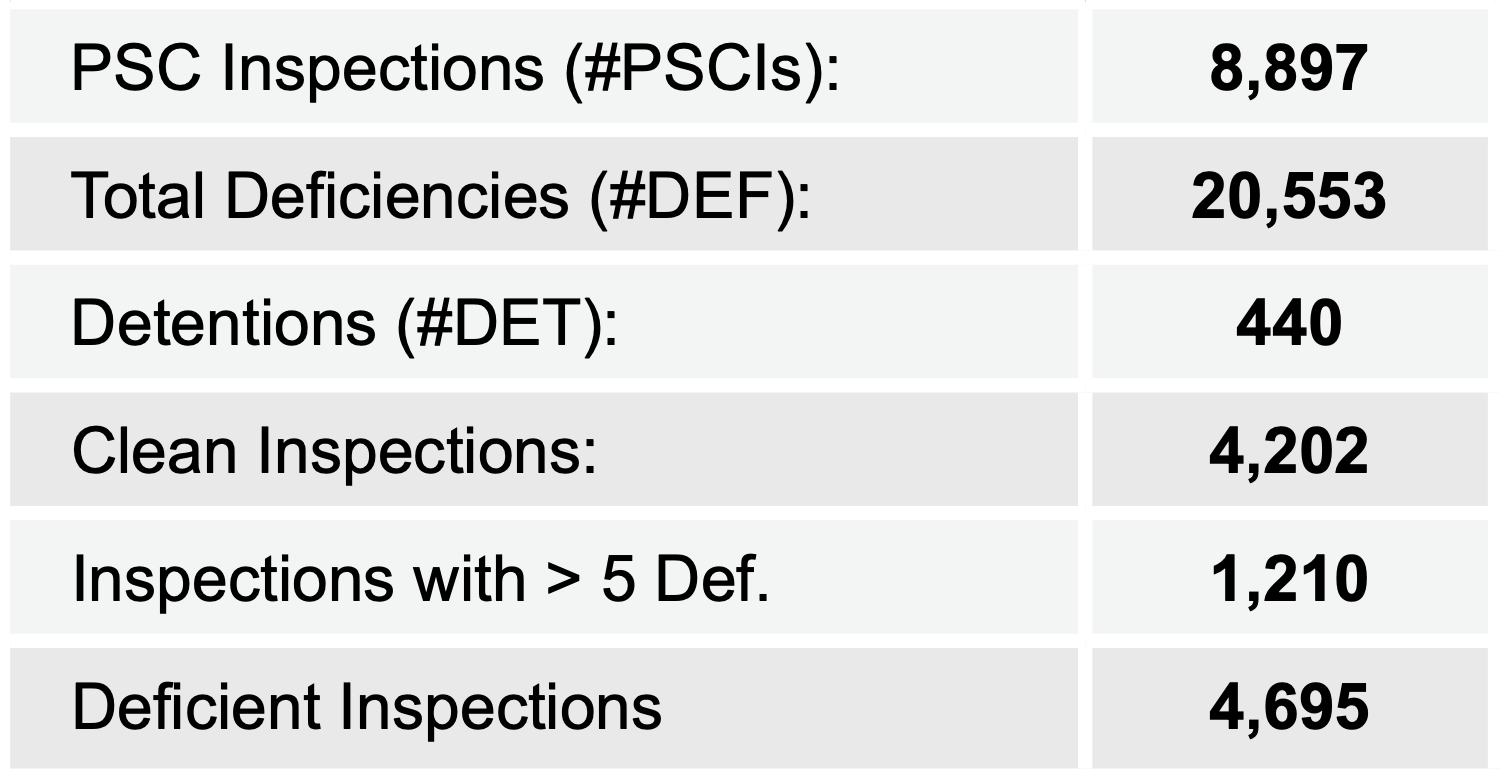
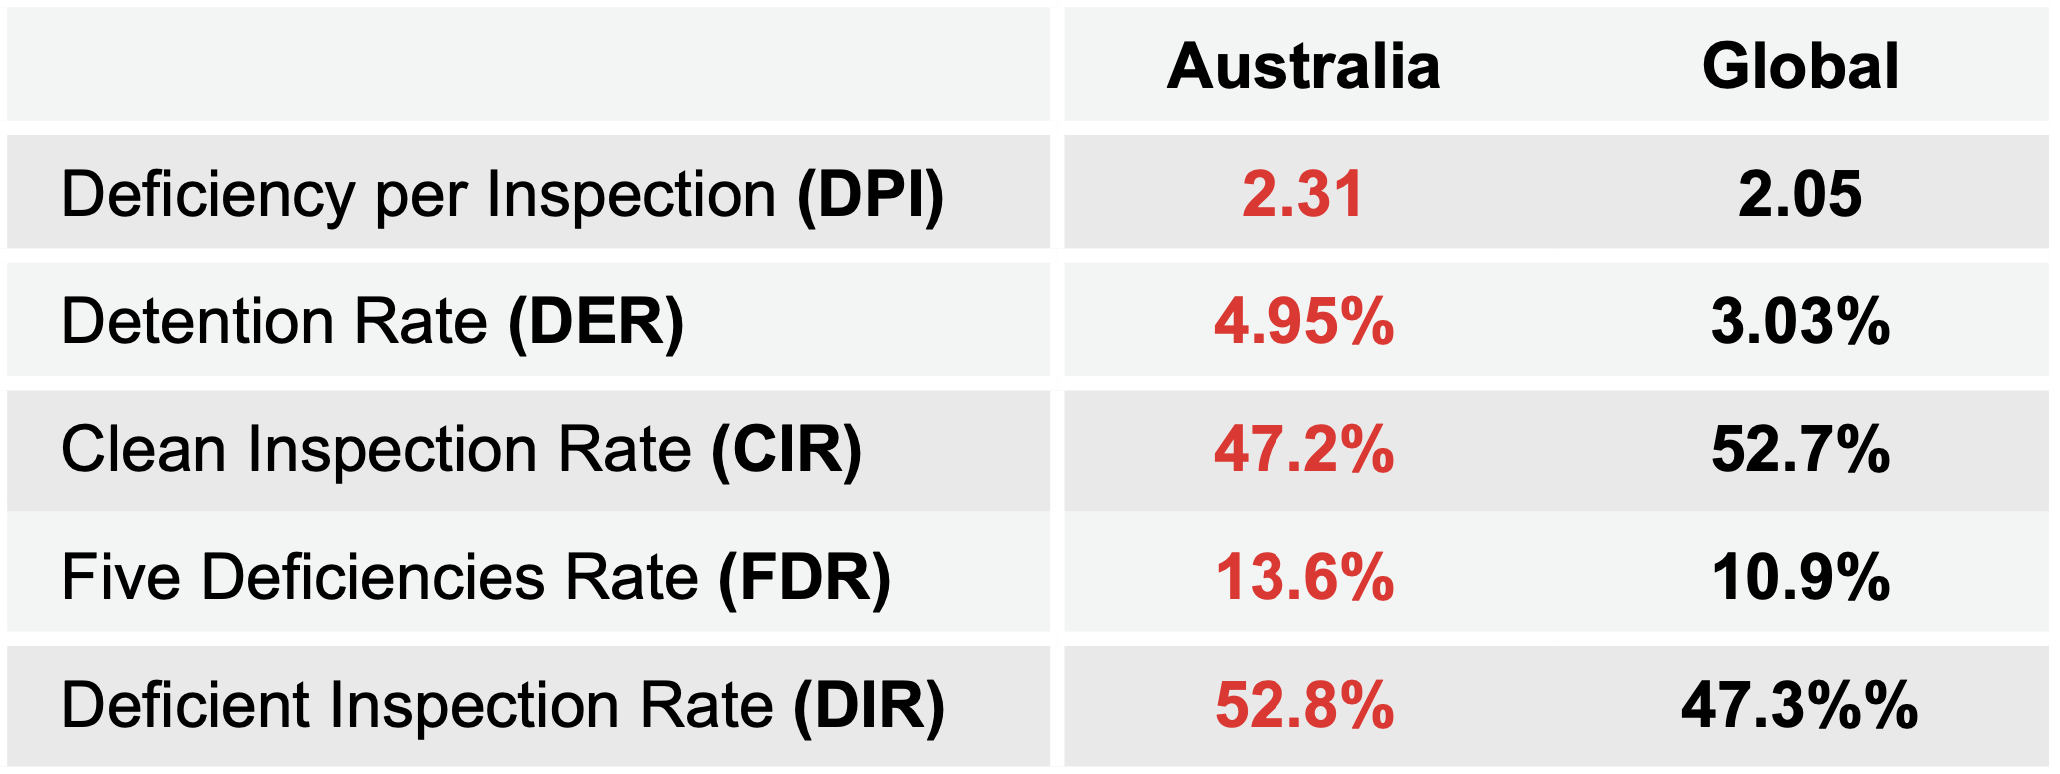
This RISK4SEA Report about Australia PSC Scorecard L36M (Sep. 2022 – Aug. 2025) includes key performance indicators (KPIs), analysing the Australia detention rate vs the Tokyo MoU detention rate. The Most Common Detainable Deficiency per Fleet Segment is also showcasing.
Key Figures

Key Performance Indicators (KPI)

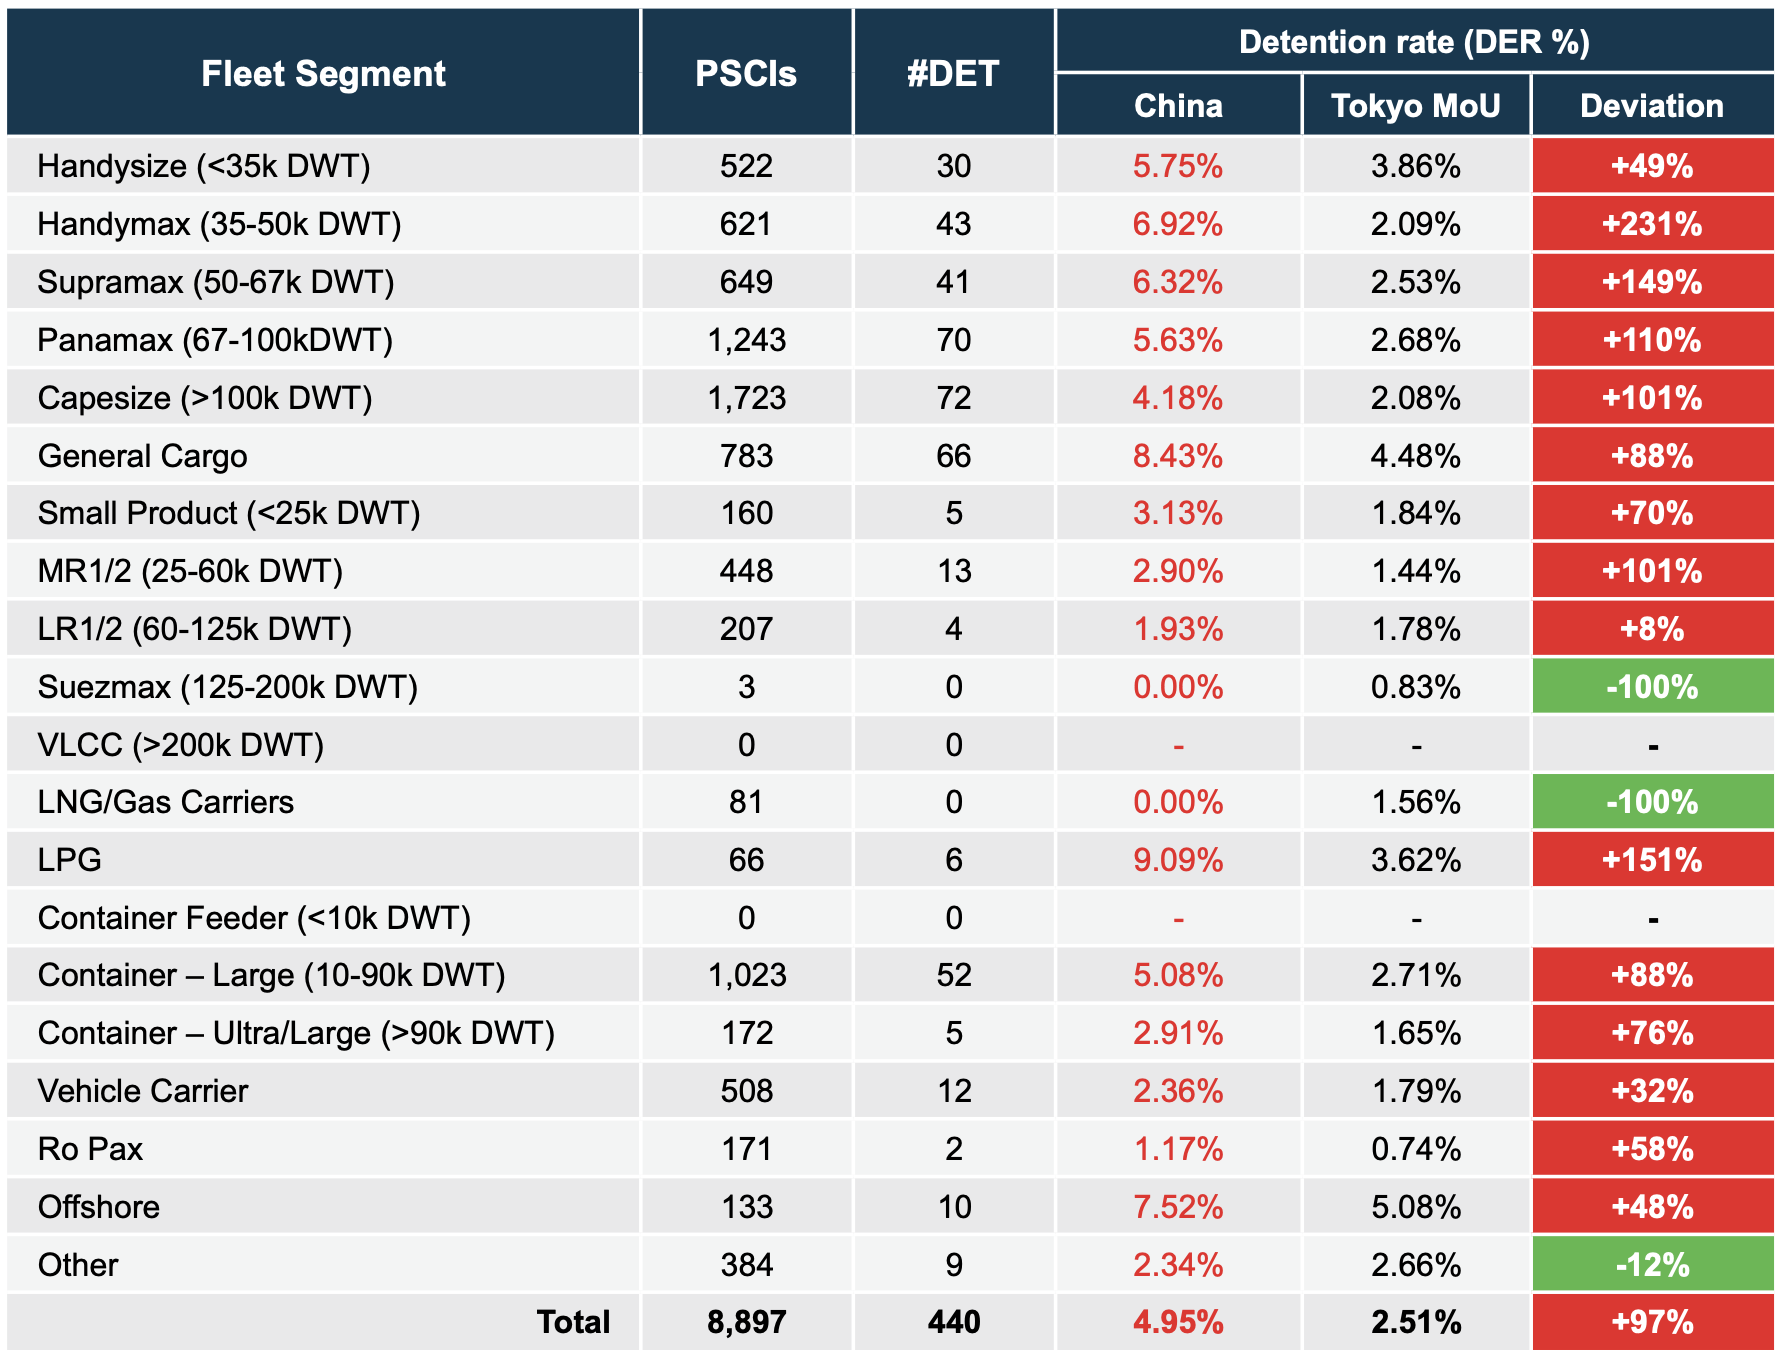
Australia DER % vs Tokyo MoU DER %

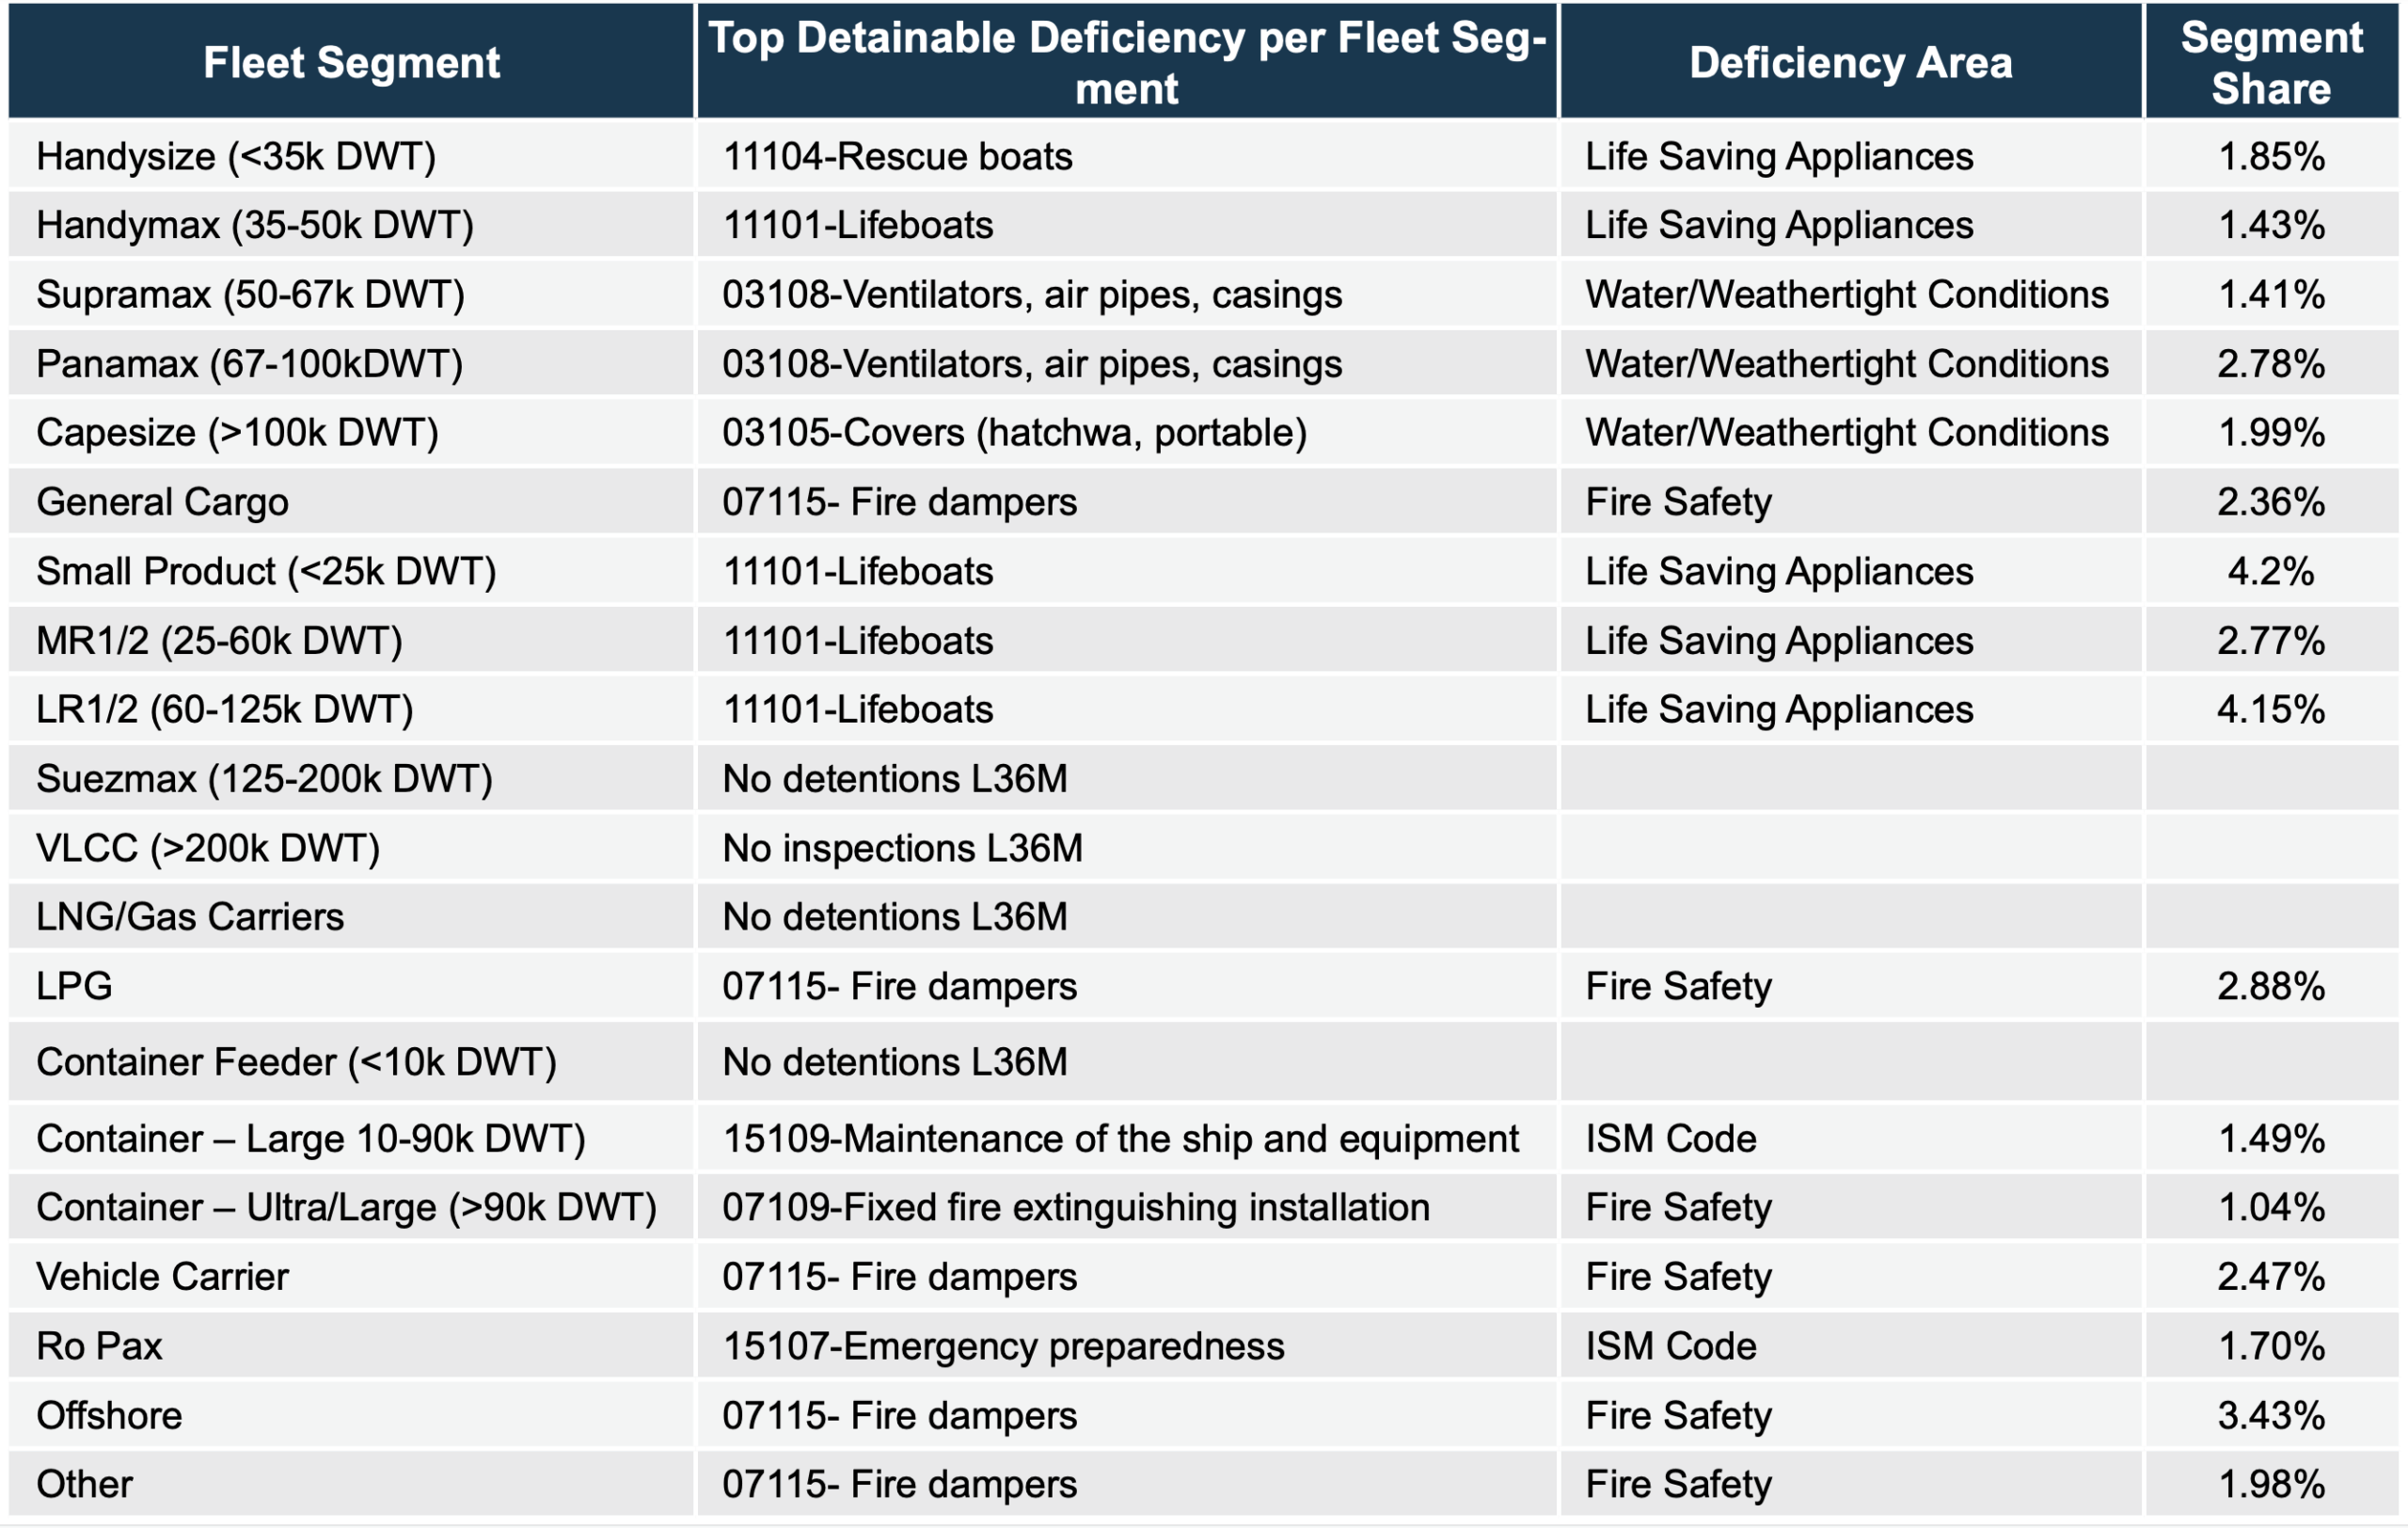
Most Common Detainable Deficiency per Fleet Segment

Highlights
- Australia is a challenging PSC area specially for dry cargo (Bulk Carriers and Containers)
- All dry cargo fleet segments mark Detention Rate higher than relevant Tokyo MoU.
- LPG show a significant problematic PSC Performance with 9% Detention Rate.
- From 16 fleet segments with detentions in Australia L36M, 5 of them had DC 07115 – Fire Dampers and other 5 had 11101 & 11104– Life boats/Rescue Boats as most detainable deficiency code. Overall Fire safety and Life Saving appliances are the most challenging detainable deficiency categories in Australia .
