Global Capesize PSC Analytics L12M (Aug. 2020 – Aug. 2021)
This RISK4SEA Report about PSC inspections for Capesize globally for the last 12 months (Aug. 2020- Aug. 2021) includes age group share in PSC results, most challenging ports, most common deficiency codes, and the most common detainable deficiencies.
Global Inspections Data (August 2020 to August 2021) Capesize (>100 KT DWT)

PSC KPIs

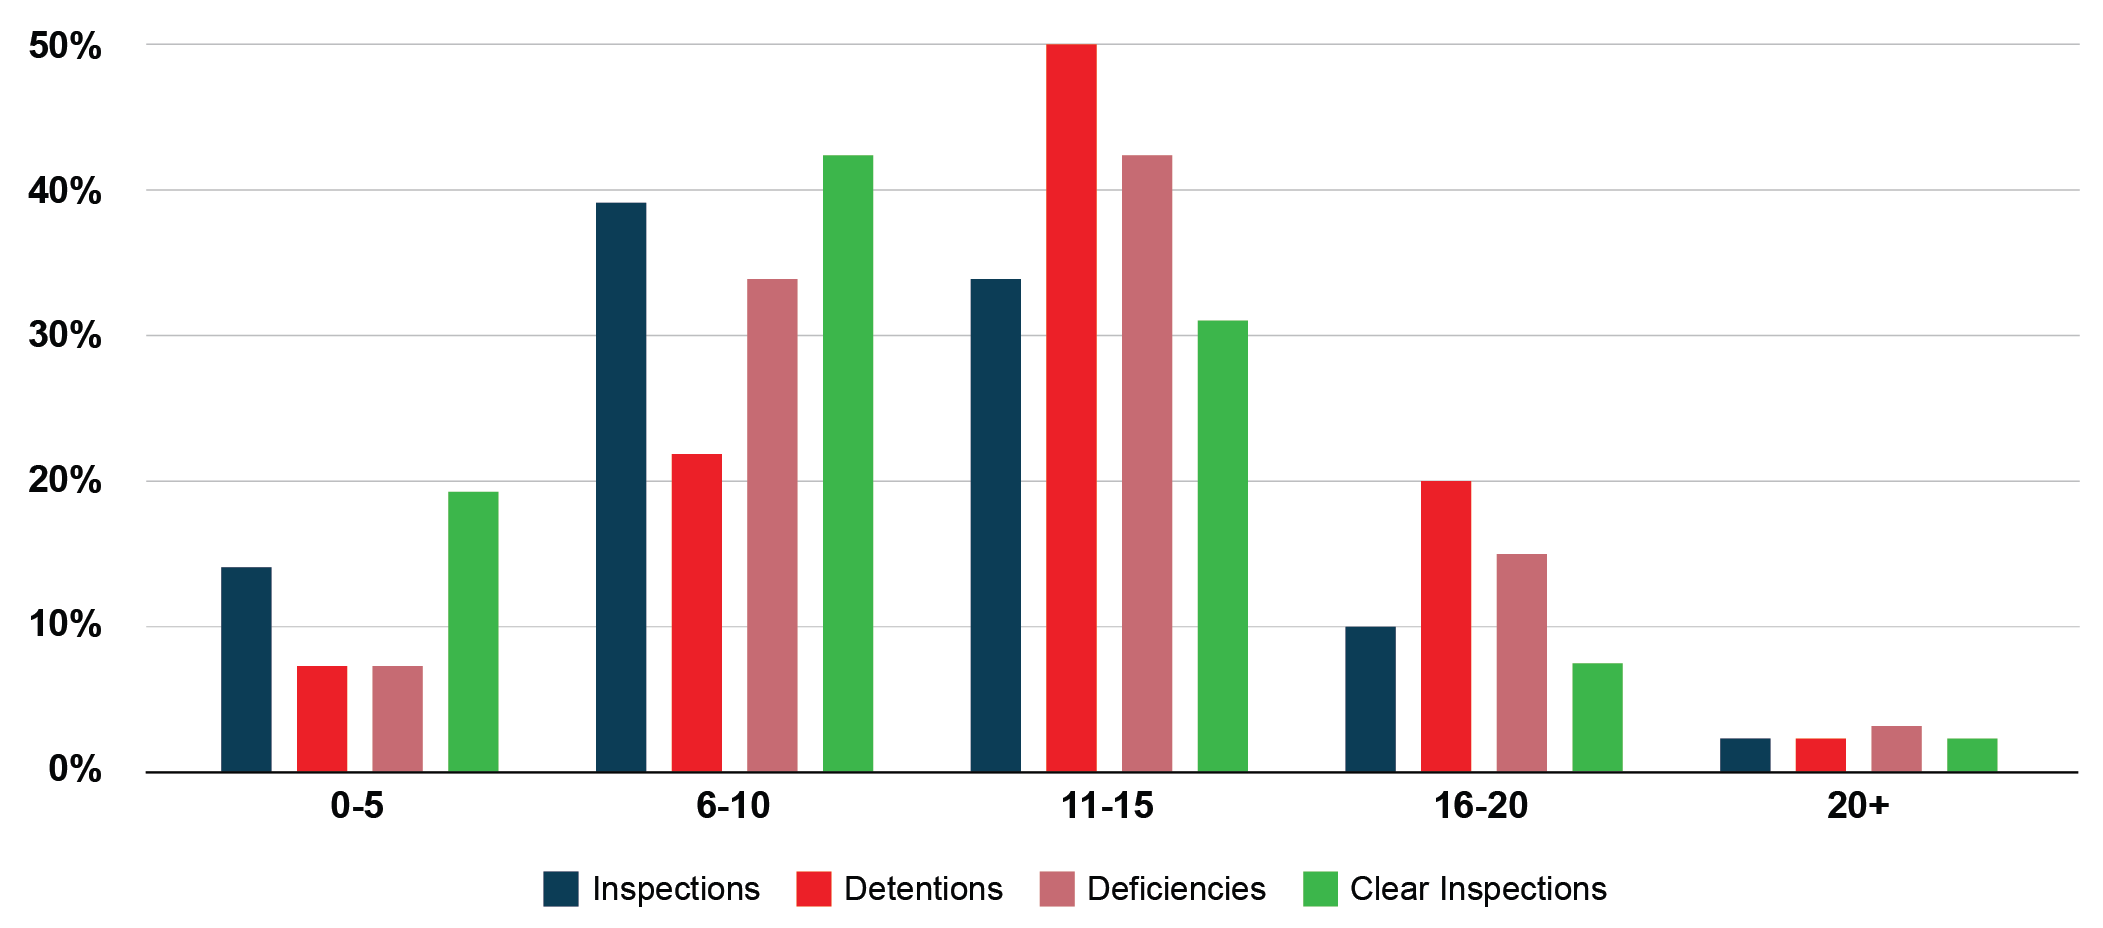
Age Group Analytics

Age Group Share in PSC Results

Above inspections conducted in 153 Ports. Inspection average per port 14 inspections.
The distribution of number of detentions was:
0 Detentions – 138 Ports – 90.20% of total.
1 Detention – 8 Ports – 5.23% of total.
2 Detentions – 2 Ports – 1.31% of total.
3 Detentions – 1 Ports – 1.31% of total.
4 Detentions – 1 Port – 0.65% of total.
5+ Detentions – 2 Ports – 1.31% of total.
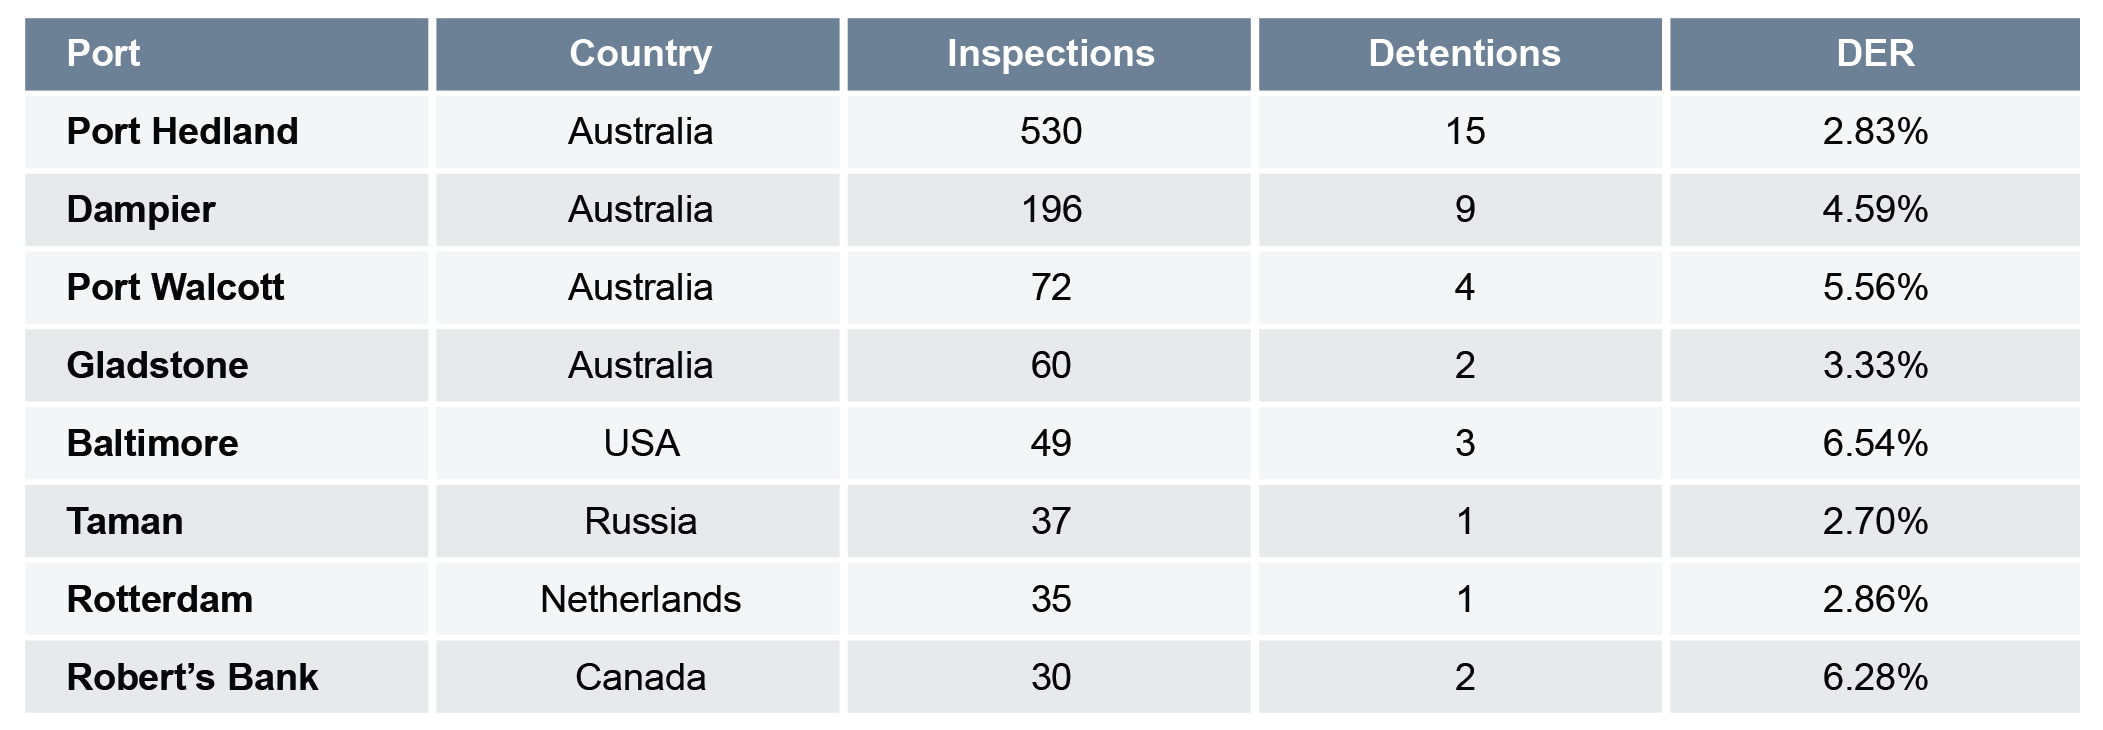
Port with the highest DER (6.54%) during this period was Baltimore, Maryland, USA.
Port with the highest number of inspections (92) and 0% DER was Newcastle, Australia.
Most Challenging ports for Capesize Bulk Carriers

Port Hedland Australia, is the port with the highest number of inspections during this period
Most common deficiency codes – Capesize
(August 2020 – August 2021)

Most common detainable deficiency codes – Capesize
(August 2020 – August 2021)

About RISK4SEA | www.risk4sea.com | Client List https://bit.ly/3L4ulcI
RISK4SEA is a SaaS PSC Intelligence platform, illuminating PSC performance to Prepare/Assess PSC inspections, Benchmark against competition and Automate PSC functions and alerts to eliminate detentions and minimize OPEX.
