Tankers PSC Performance – CY2024
This RISK4SEA Report about Tankers PSC Performance for 2024 includes key figures of Calls and PSCIs, the top 5 Deficiency Codes and the Most Common PSC Deficiency codes.
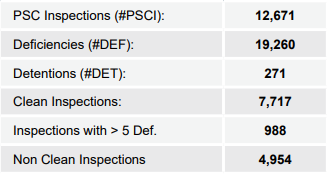
Key PSC Tankers Figures

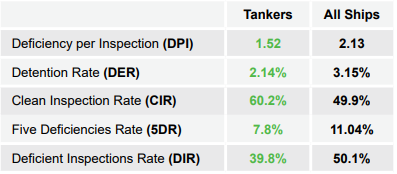
Key Performance Indicators (KPI)

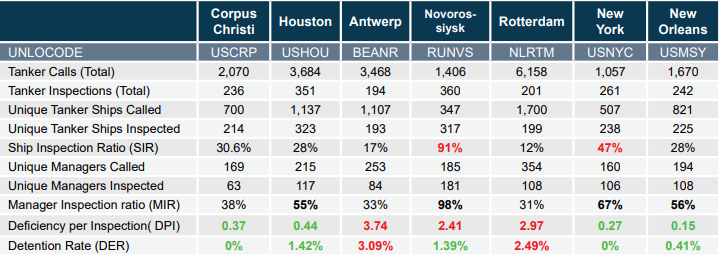
Tankers Key Figures of Calls and PSC Inspections in Ports with highest number of PSCIs

Highlights
- Tankers’ PSC KPIs are better than the overall fleet. Tanker vessels under TMSA and SIRE 2.0 Inspections have better results during PSCIs as they have advanced vetting procedures in place.
- Some ports (with high number of tankers PSCIs) have significant higher KPIs than Global Overall. For example, the detention rate of Antwerp on tankers is 3 times the global value. Additionally, Rotterdam seems to be also a difficult PSC station for tankers.
- USCG ports (New York/New Orleans/Houston/Corpus Christi) seem to be less challenging, in respect of PSC inspection results.
- Novorossiysk has the higher inspection/call ratio for both ships and managers in tanker sector.
Top 5 Deficiency Codes Tankers (CY2024)

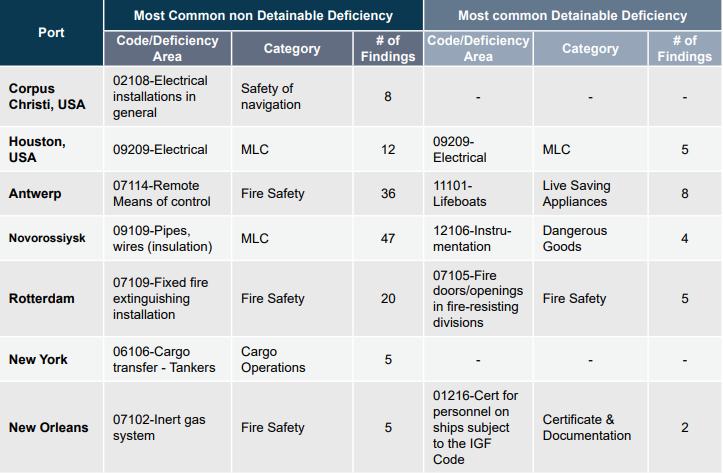
Most Common Deficiency codes on Tankers PSC inspections

