Insights
Primary PSC KPIs (DPI/DER) for the CY 2025
RISK4SEA is announcing the Primary Port State Control Key Performance Indicators (PSC KPIs) for the period of Calendar Year 2025 with the objective to illuminate PSC performance across the major PSC regimes.
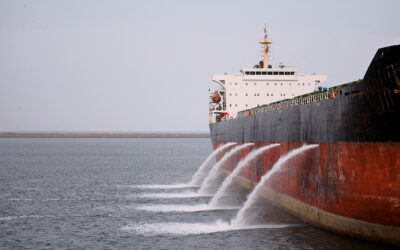
PSC CIC on Ballast Water Management (BWM) – Results Report
RiSK4SEA presents insights from the total period of 90 days of the BWM CIC, revealing that ballast water record keeping, system operation, management plans, and crew training are key areas of focus.

Novorossiysk PSC Scorecard L36M (Oct. 2022 – Sep. 2025)
This RISK4SEA Report about Novorossiysk PSC Scorecard L36M (Oct. 2022 – Sep. 2025) includes key performance indicators (KPIs), analysing the Novorossiysk detention rate vs the Black Sea MoU detention rate.
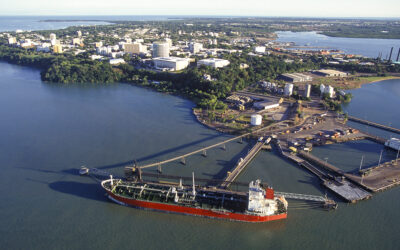
Australia PSC Scorecard L36M (Sep. 2022 – Aug. 2025)
This RISK4SEA Report about Australia PSC Scorecard L36M (Sep. 2022 – Aug. 2025) includes key performance indicators (KPIs), analysing the Australia detention rate vs the Tokyo MoU detention rate.

Primary PSC KPIs (DPI/DER) for YTD 2025 (JAN 25-SEP 25)
RISK4SEA is announcing the Primary Port State Control Key Performance Indicators (PSC KPIs) for the period of January to September 2025 with the objective to illuminate PSC performance across the major PSC regimes.

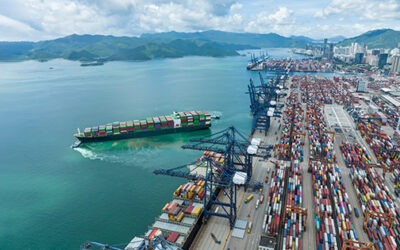
China PSC Scorecard L36M (Sep. 2022 – Aug. 2025)
This RISK4SEA Report about China PSC Scorecard L36M (Sep. 2022 – Aug. 2025) includes key performance indicators (KPIs) , analysing the China detention rate vs the Tokyo MoU detention rate.
Primary PSC KPIs (DPI/DER) for H1 2025
RISK4SEA is announcing the Primary Port State Control Key Performance Indicators (PSC KPIs) for the period of the H1 2024 with the objective to illuminate PSC performance across the major PSC regimes.

Global PSC Detentions – H1 CY2025
This RISK4SEA Report about PSC Detentions globally for the 1st half of 2025 includes key figures and global PSC KPIs, the most common detainable deficiencies and ports with the most inspections per fleet segment.