INSIGHTS
PSC Highlights for Ports 2022
This RISK4SEA Report about PSC Highlights for Ports 2022 includes ports with high number of inspections and 0 detentions per fleet segment.
Australia – Capesize (>100k dwt) PSC Intelligence – CY2022
This RISK4SEA Report about PSC inspections for Capesize (>100k dwt) in Australia for 2022 includes inspection data, key figures of calls and PSC inspection and the most Common Deficiency codes.
Global PSC Detentions – CY2022
This RISK4SEA Report about PSC Detentions globally for 2022 includes global key PSC Figures and global Key Performance Indicators (KPIs), the Most Common Detainable Deficiency and the Ports with most Inspections per Fleet Segment.
Primary PSC KPIs (DPI/DER) for the CY2022
RISK4SEA is announcing the Primary Port State Control Key Performance Indicators (PSC KPIs) for the period of the Calendar year 2022 with the objective to illuminate PSC performance across the major PSC regimes.
Global PSC – Most Common Deficiency Codes L36M (Dec. 2019 – Nov. 2022)
This RISK4SEA Report about most common deficiency codes for PSC inspections globally for the last 36 months (Dec. 2019 – Nov. 2022) includes deficiency code spread along with many insights.
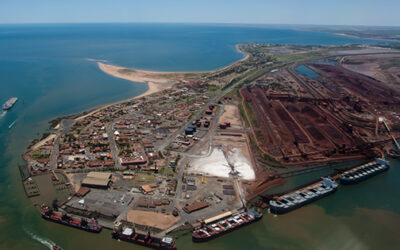
Port Hedland PSC Highlights Capesize L36M (Nov. 2019 – Oct. 2022)
This RISK4SEA Report about PSC Inspections Highlights for Capesize in Port Hedland for the last 36 months (Nov. 2019 – Oct. 2022) includes unique inspections vs unique calls & re-inspections, deficiencies code profile (top 25) along with many insights.
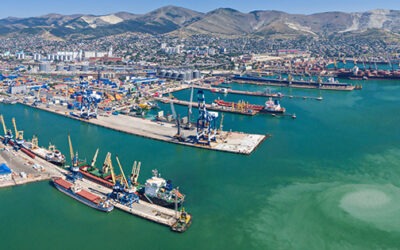
Novorossiysk PSC Scorecard L6M (Apr. 2022 – Sep. 2022)
This RISK4SEA Scorecard about PSC inspections in Novorossiysk for the last 6 months (Apr. 2022 – Sep. 2022), includes unique inspections vs unique calls and the most common deficiencies per fleet segment, along with many insights.
Singapore PSC Scorecard – H1 CY2022
This RISK4SEA Report about PSC inspections in Singapore for the 1st half of 2022 includes unique inspections vs unique calls.
Global PSC Detentions – H1 CY2022
This RISK4SEA Report about PSC Detentions globally for the 1st half of 2022 includes most common detainable deficiencies and ports with most inspections per fleet segment.

Global PSC Scorecard – H1 CY2022
This RISK4SEA Report about PSC inspections globally for the 1st half of 2022, includes ship type & age detention analysis and most common detainable deficiencies.

Global PSC Detentions – Q1 CY2022
This RISK4SEA Report about PSC detentions globally for the Q1 of 2022 includes ship type & age detention analysis, and top 10 common detainable deficiency codes.

PSC Highlights for Ports – CY2021
This RISK4SEA Report about PSC Highlights for Ports 2021 includes ports with high number of inspections and 0 detentions per fleet segment.

Paris MoU Bulk Carriers PSC Performance – CY2021
This RISK4SEA Report about Bulk Carriers PSC Performance in Paris MoU for 2021 includes age group analysis, most common deficiencies, most common detainable deficiencies and ports with increased inspection work on bulk carriers.
Global PSC – Most Common Deficiency Codes – CY2021
This RISK4SEA Report about Most Common Deficiency Codes for PSC inspections globally for 2021 includes deficiency code spread.
Port Hedland PSC Inspections vs Calls – 2021 Overview
This RISK4SEA Report about PSC Inspections vs Calls in Port Hedland for 2021 includes ship type & age detention analysis, ships inspected vs ships called and top 5 deficiency codes.
Novorossiysk PSC Inspections vs Calls – 2021 1st Semester
This RISK4SEA Report about PSC Inspections vs Calls in Novorossiysk for the 1st Semester 2021 includes ship type & age detention analysis, ships inspected vs ships called and top 5 deficiency codes.

Global PSC Scorecard – Detentions (Q3 2021)
This RISK4SEA Report about PSC inspections globally for the Q3 of 2021 includes detentions per manager base country, detainable deficiencies areas, ship type & age detention analysis, detention rate vs ship age and top detainable deficiencies.

China – Bulk Carriers Deficiency Code Ranking L12M (Sep. 2020 – Aug. 2021)
This RISK4SEA Report about Deficiency Code Ranking for Bulk Carriers in China for the last 12 months (Sep. 2020 – Aug. 2021) includes top 20 ranked deficiency codes and highlights.

Global Capesize PSC Analytics L12M (Aug. 2020 – Aug. 2021)
This RISK4SEA Report about PSC inspections for Capesize globally for the last 12 months (Aug. 2020- Aug. 2021) includes age group share in PSC results, most challenging ports, most common deficiency codes, and the most common detainable deficiencies.

Black Sea MoU PSC Scorecard 2020
This RISK4SEA Report about Black Sea MoU PSC scorecard for 2020 includes ship type & age analysis, detention rate vs ship age, ship age and group performance, detentions per nanager base country, MoU most busiest ports, most common deficiency codes and the most common detainable deficiencies.